1
$\begingroup$

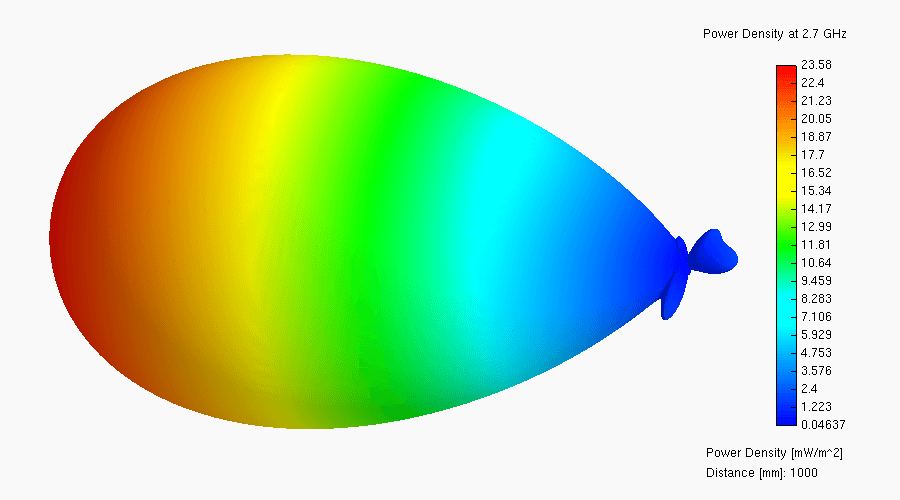
Why does the power density of yagi antenna beam propagation diagrams increase as the distance to the source increases? Shouldn't the signal get worse as the distance increases or does that only happen after a certain threshold, because this makes it seam, as if the yagi beam is getting stronger...

enter image description here

Any help is appreciated!

$\endgroup$

1 Answer 1

2
$\begingroup$

Why does the power density of yagi antenna beam propagation diagrams increase as the distance to the source increases?

It doesn't! You're misinterpreting the diagram.

The radius off the radiation pattern is, like color, the indicator of spatial power density in that direction. Distance doesn't appear in these diagrams.

$\endgroup$
3
  • $\begingroup$ What software is that? All that I can think of is Xnec2c (for Linux), but that's not it. Also, please see this meta post. :-) $\endgroup$ Commented May 24 at 19:15
  • 1
    $\begingroup$ 3D radiation patterns, @MikeWaters? Might be Matlab's antenna workbench, judging by the font of the legend? Maybe CST studio, but I don't remember that specific colorscheme (but it's been a while…). There's a few other tools that can do such diagrams! $\endgroup$ Commented May 24 at 20:26
  • $\begingroup$ I think it's 4NEC2. $\endgroup$ Commented May 24 at 21:37

You must log in to answer this question.

Not the answer you're looking for? Browse other questions tagged .