This would usually take a course in Transmission Line Theory, but we can give you the mechanical solution really quickly.
Behold: THE SMITH CHART (in impedance form):
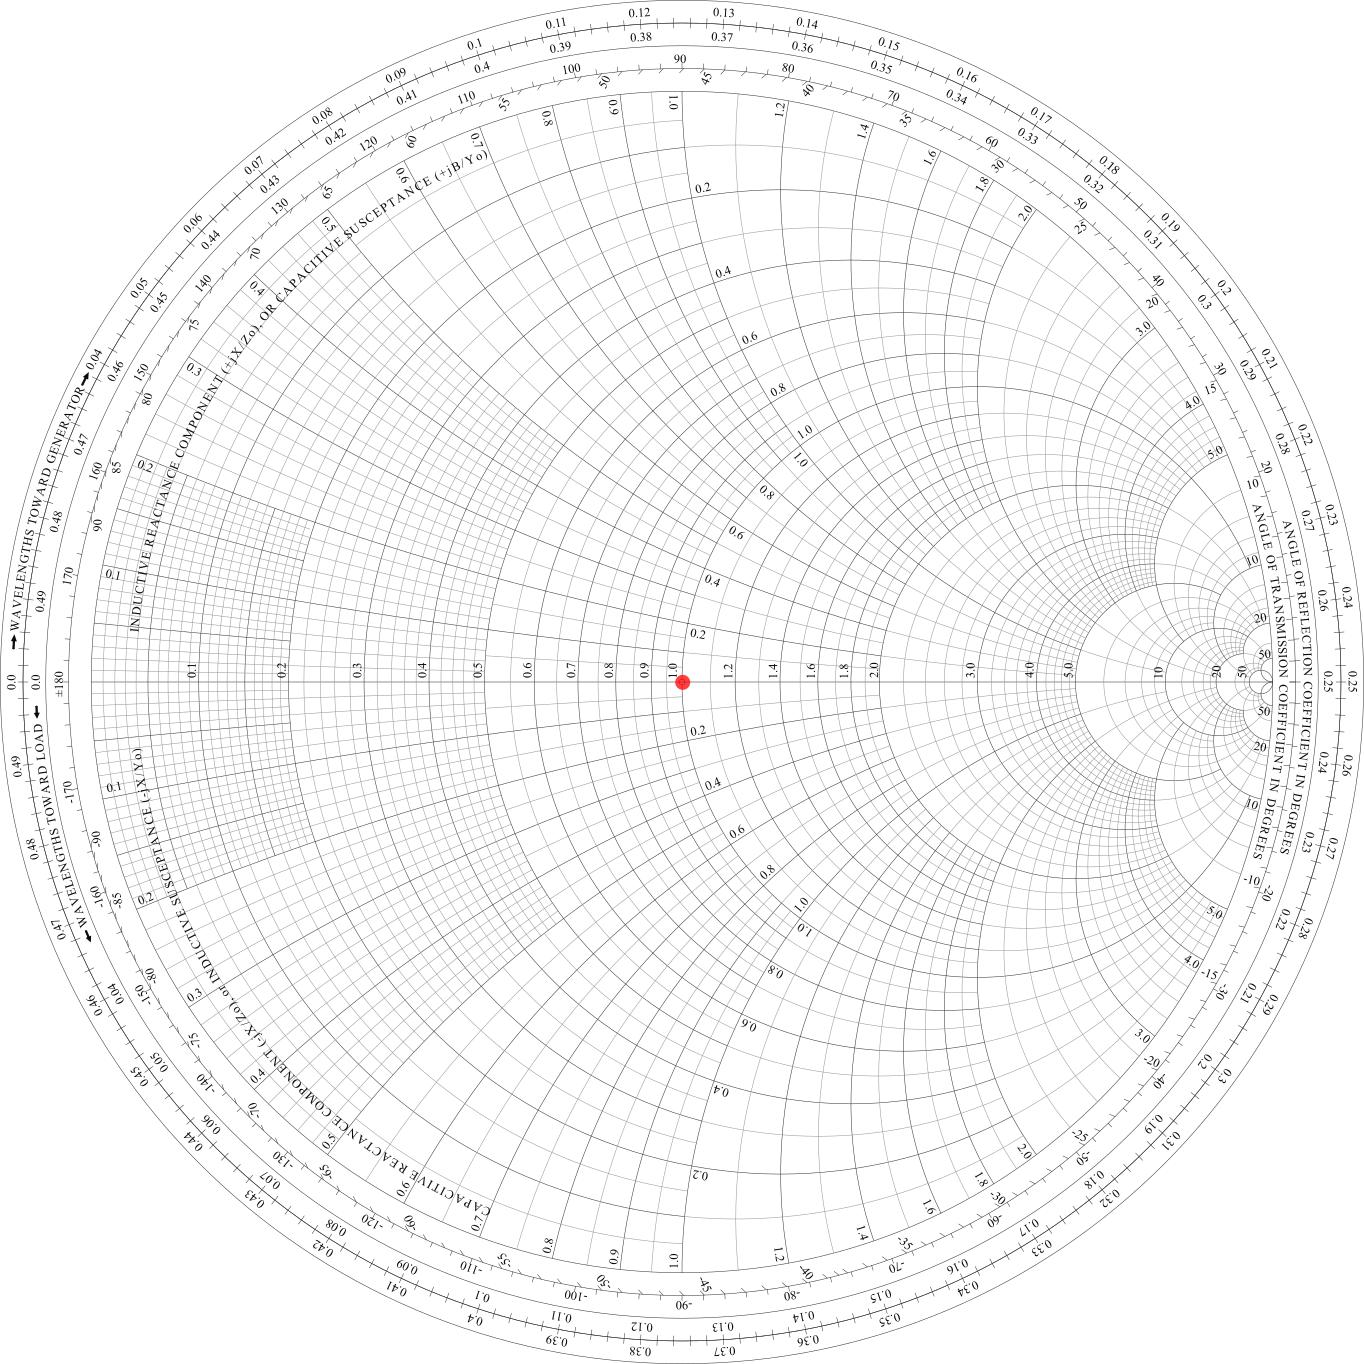
Wow. A mandala! A fractal! What the flying heck?
It's a tool electrical engineers use to describe passive RF systems, which are composed of
- resistors (and things that have a purely resistive characteristic),
- capacitors,
- inductors,
- transformers, and
- transmission lines
in series or in parallel with the load.
The idea is simple: What matters of a load is its relation to the reference impedance of the system – a 100 Ω load looks to a 50 Ω system like a 150 Ω load to a 75 Ω system, for example. This doesn't only apply to loads, but also to all other components in a system. Aha.
So, we start out by setting our reference impedance (something like: what our amplifier has, or our cabling has).
In your example, let's say our reference impedance is 50 Ω (that's the most common impedance in microwave systems; there's no specific reason it has to be 50 Ω). We say
50 Ω is the new 1.
That means the little red dot in the center of our smith chart at the position "on the straight horizontal central line at 1.0, on the circular lines that cross that line at 0.0" means "50 Ω".
Let's practice that a bit: a 100 Ω load – that's 2.0 times 50 Ω. So it is here:
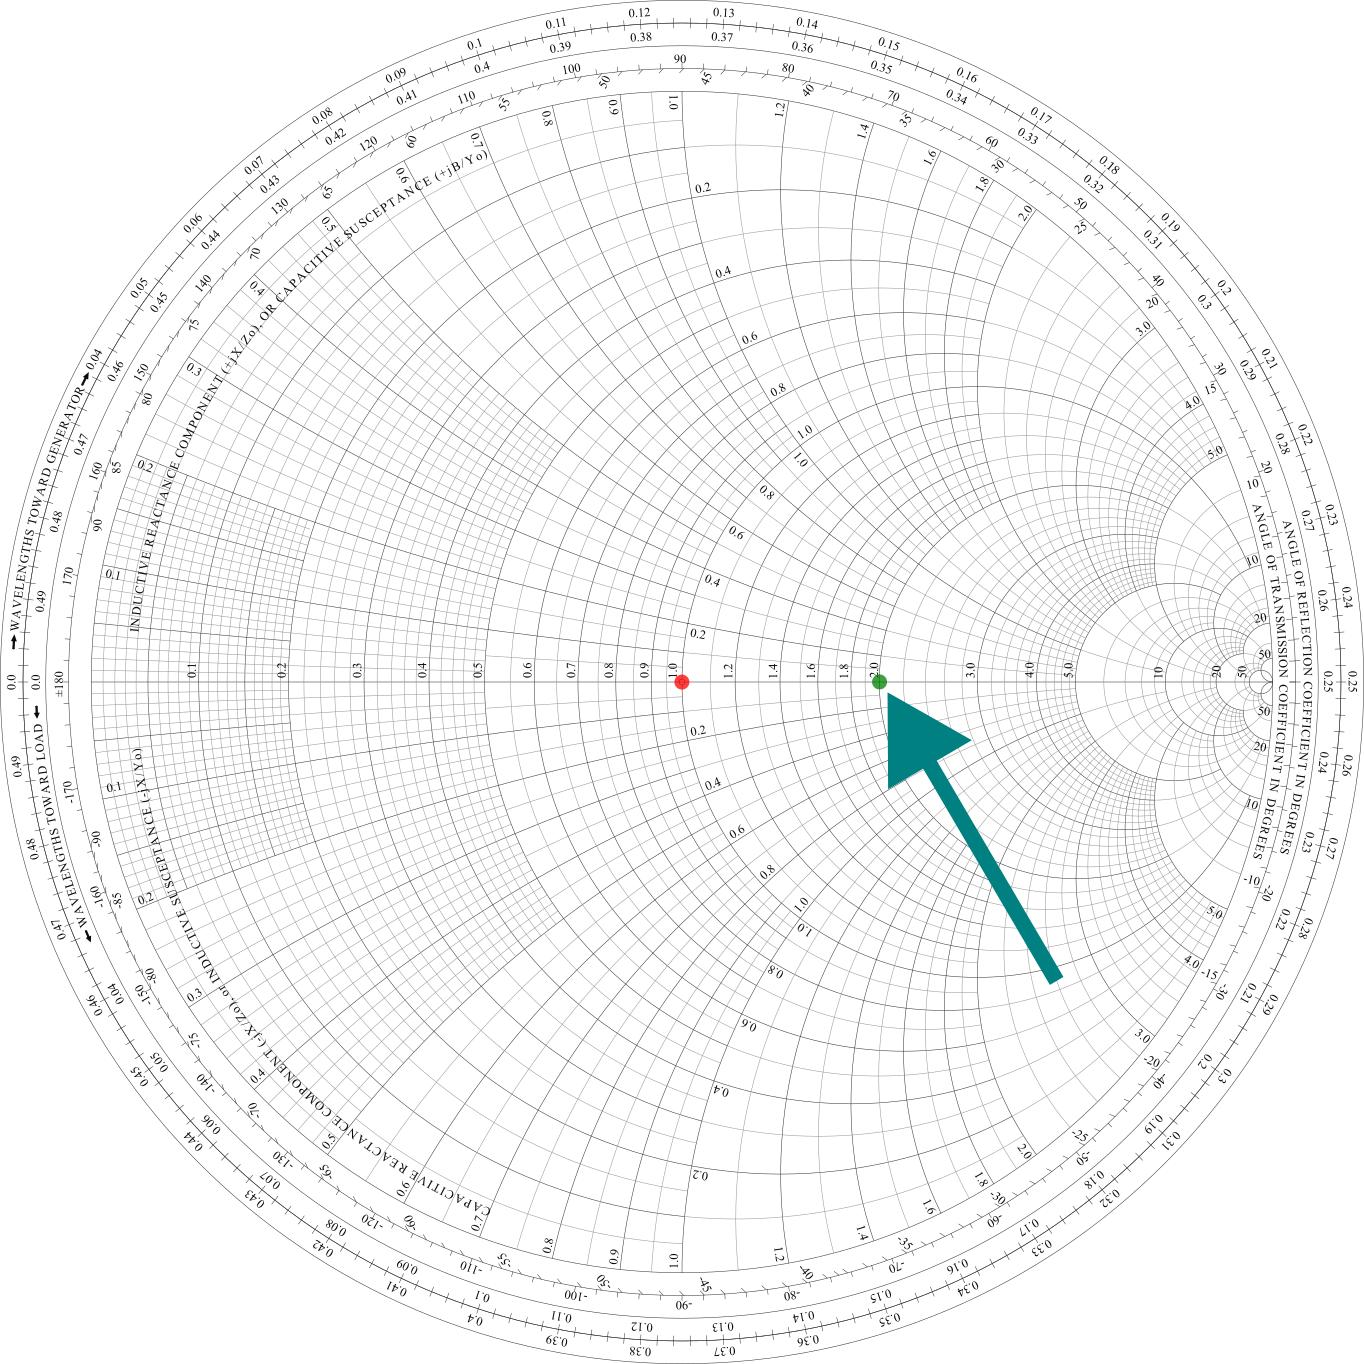
OK. That was easy. It's not hard to guess where a 25 Ω load would be: at the left-hand side of the red dot, at 0.5 (because 25 Ω = 0.5 · 50Ω, and 50Ω is our "1").
But if we can represent any load in Ω by mapping it to a point on that horizontal line, why the mandala? Was Smith an esoteric person?
Notice how all these lines that cut the horizontal line are actually circles! Circles around points on the very horizontal line.
We use this second, "circularly warped", dimension to allow us to describe arbitrary complex impedances. You might remember from circuit basics that a capacitor has an impedance of $\frac1 {j \omega C}$, with $C$ being its value (e.g. in µF), $\omega$ being the angular frequency it's being operated at (e.f. $2 \pi 144\, \text{MHz}$), and $j$ being the imaginary unit.
Similarly, there's antennas that aren't purely real in impedance (which would be ideal – it would mean the antenna could take all energy from a matched, lossless and real-valued transmission line and get rid of it). For example, a dipole of ca $0.12\lambda$ length typically has an impedance of (rough estimate) $(2.5\,-j 2000 )\text{ Ω}$. (It's not a great antenna, is it?! The capacitive part by far outweighs the ohmic part. Not very surprising if you imagine you build an antenna that's far too short for the wavelength you want to operate – it just can't get rid of the energy over the air, and the energy is shortly stored and then flows back).
So, let's look for the $(2.5\,-j 2000 )\text{ Ω}$ point in out $50\,\text{Ω}$-normalized Smith chart! $2.5\,\text{Ω} = 0.05\cdot 50\,\text{Ω}$, and $-2000\,\text{Ω} = -40\cdot 50\,\text{Ω}$. So our point is at $0.05 - j40$. Gotta look for the 0.05 on the horizontal line, then run around on the circle going through both that 0.05 point and the right end of the circle. We walk downwards until we hit 40:
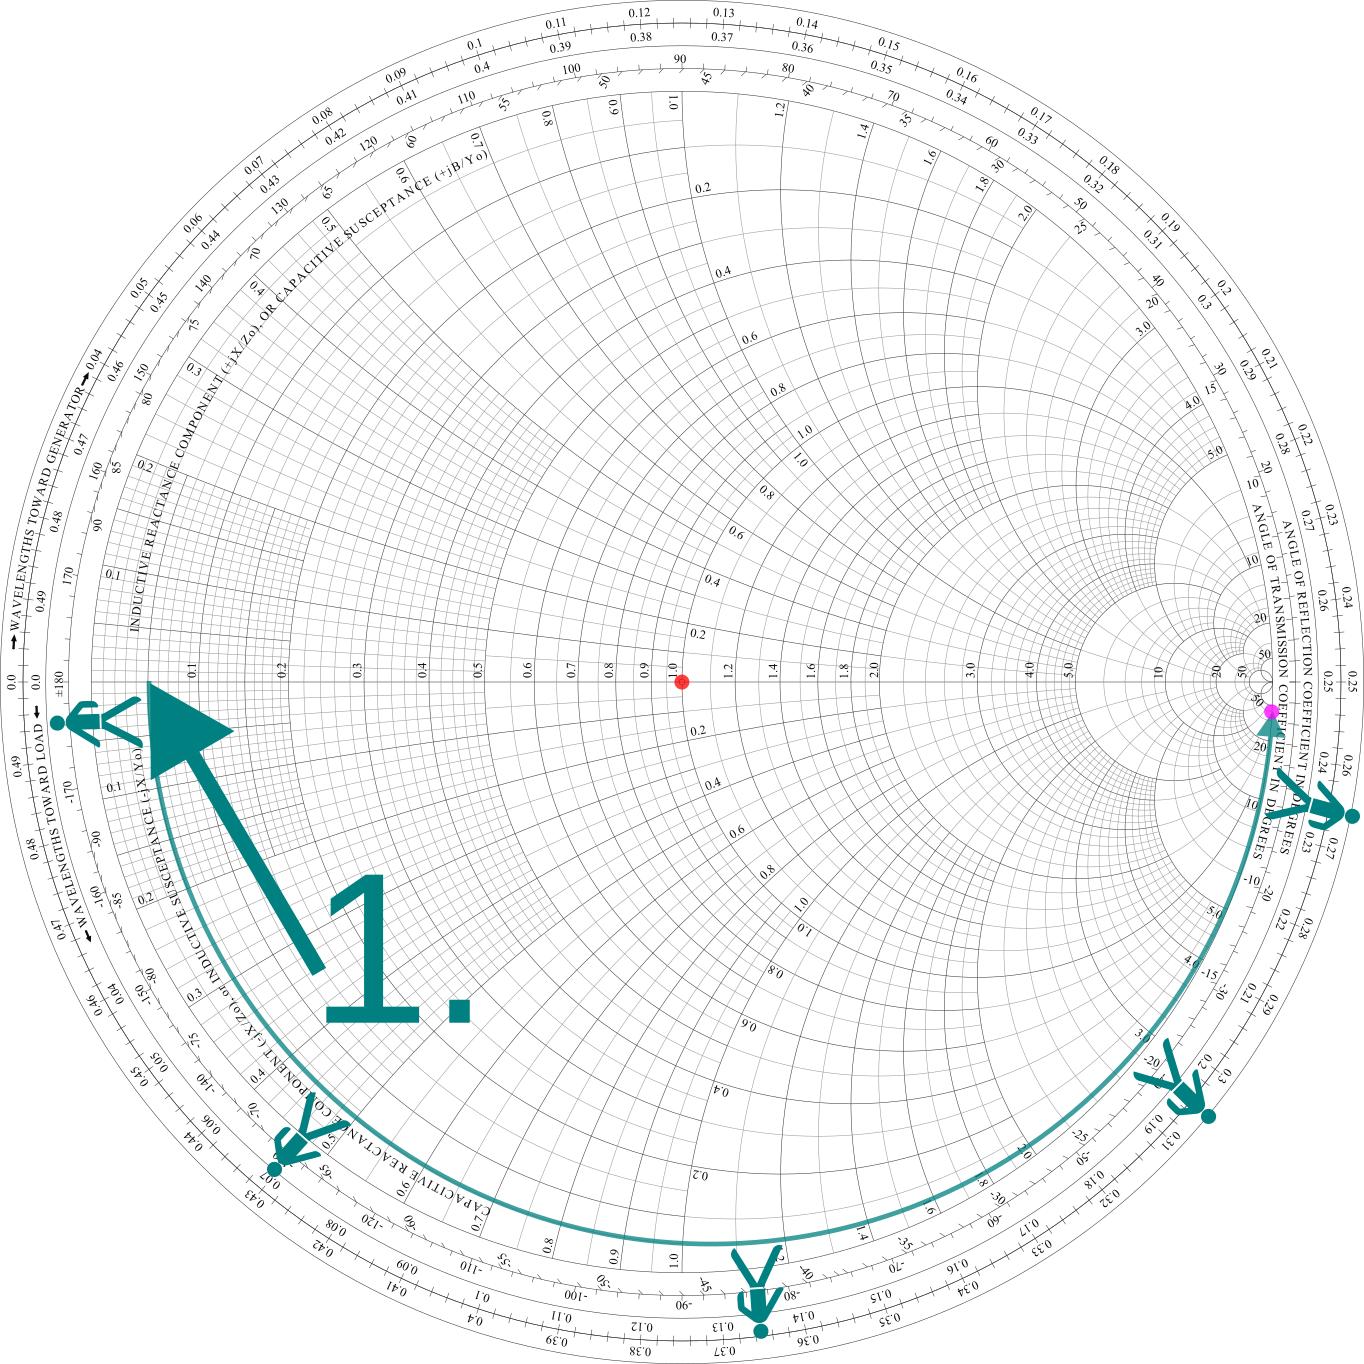
OK, removing our construction lines:
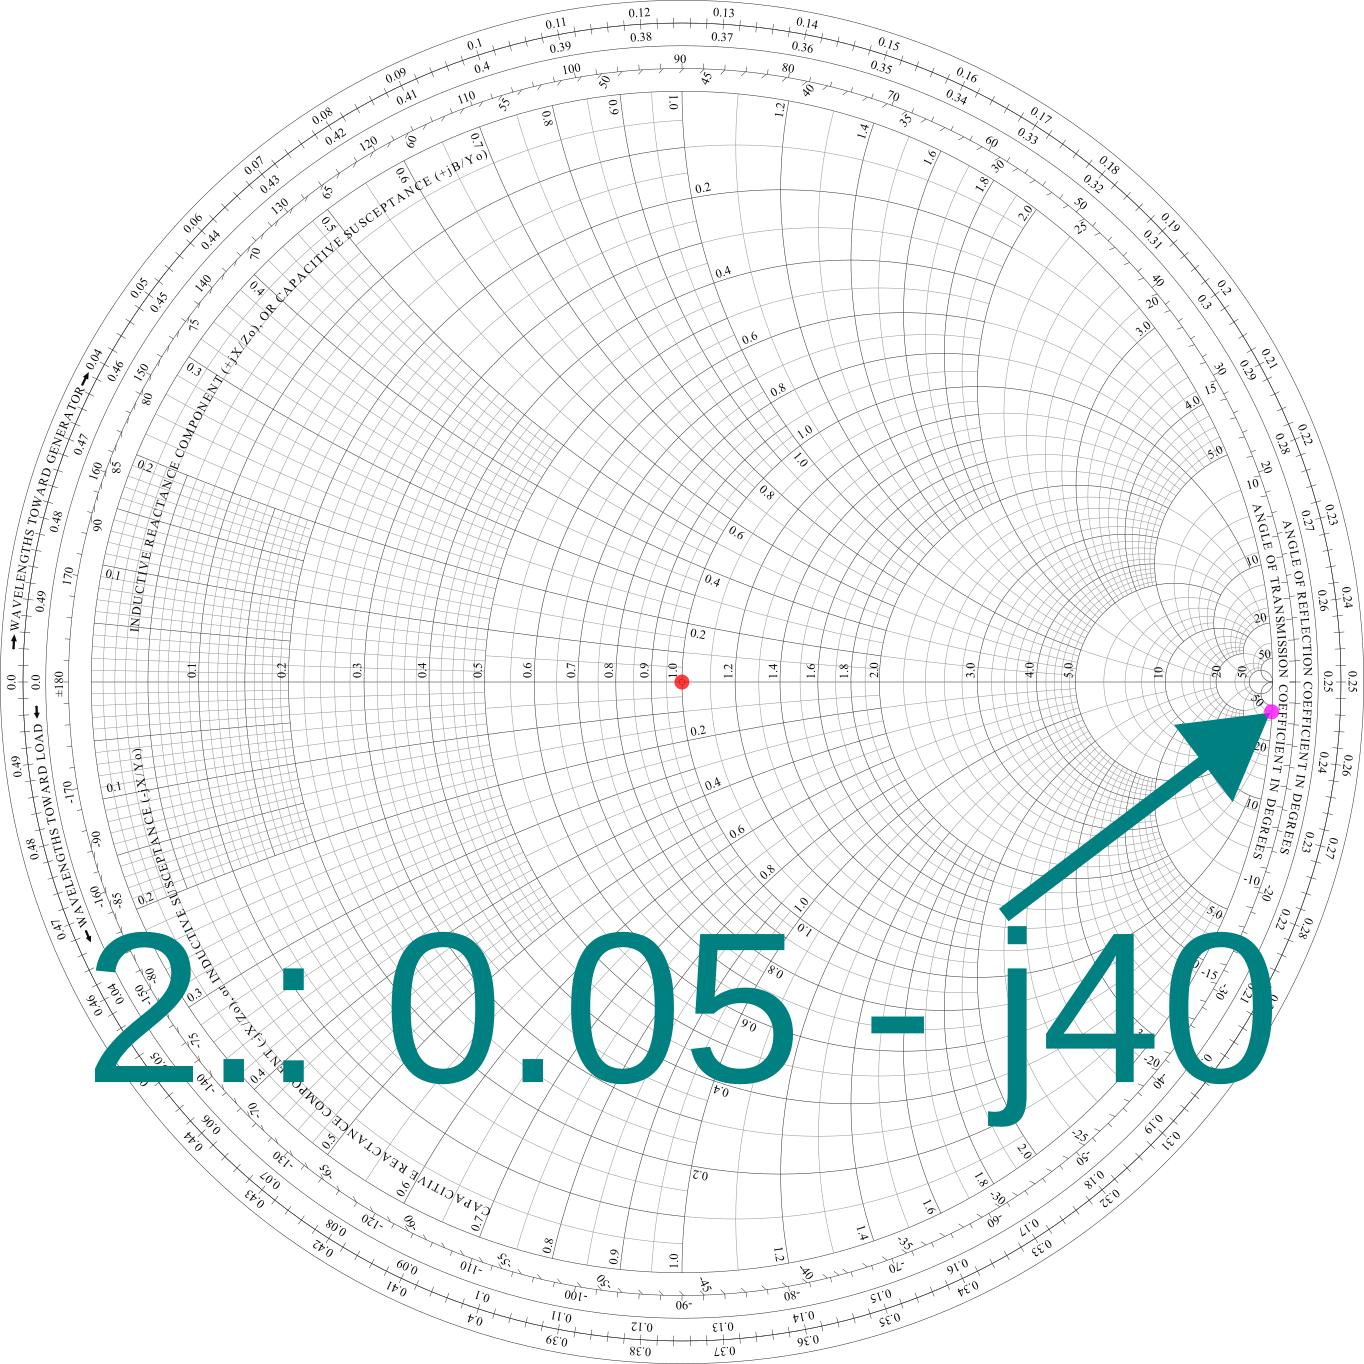
Interesting! Now we have learned how to put arbitrary antennas into our diagram.
Let's use a slightly less extreme example, which might be less well-suited for illustration, but more useful: From literature [Bal05, p. 193] we know that an ideal quarter-wavelength monopole has a feedpoint resistance of (36.5 + j21.25) Ω, or normalized to 50 Ω, it is 0.73 + j0.425. Here, the aquamarine dot:
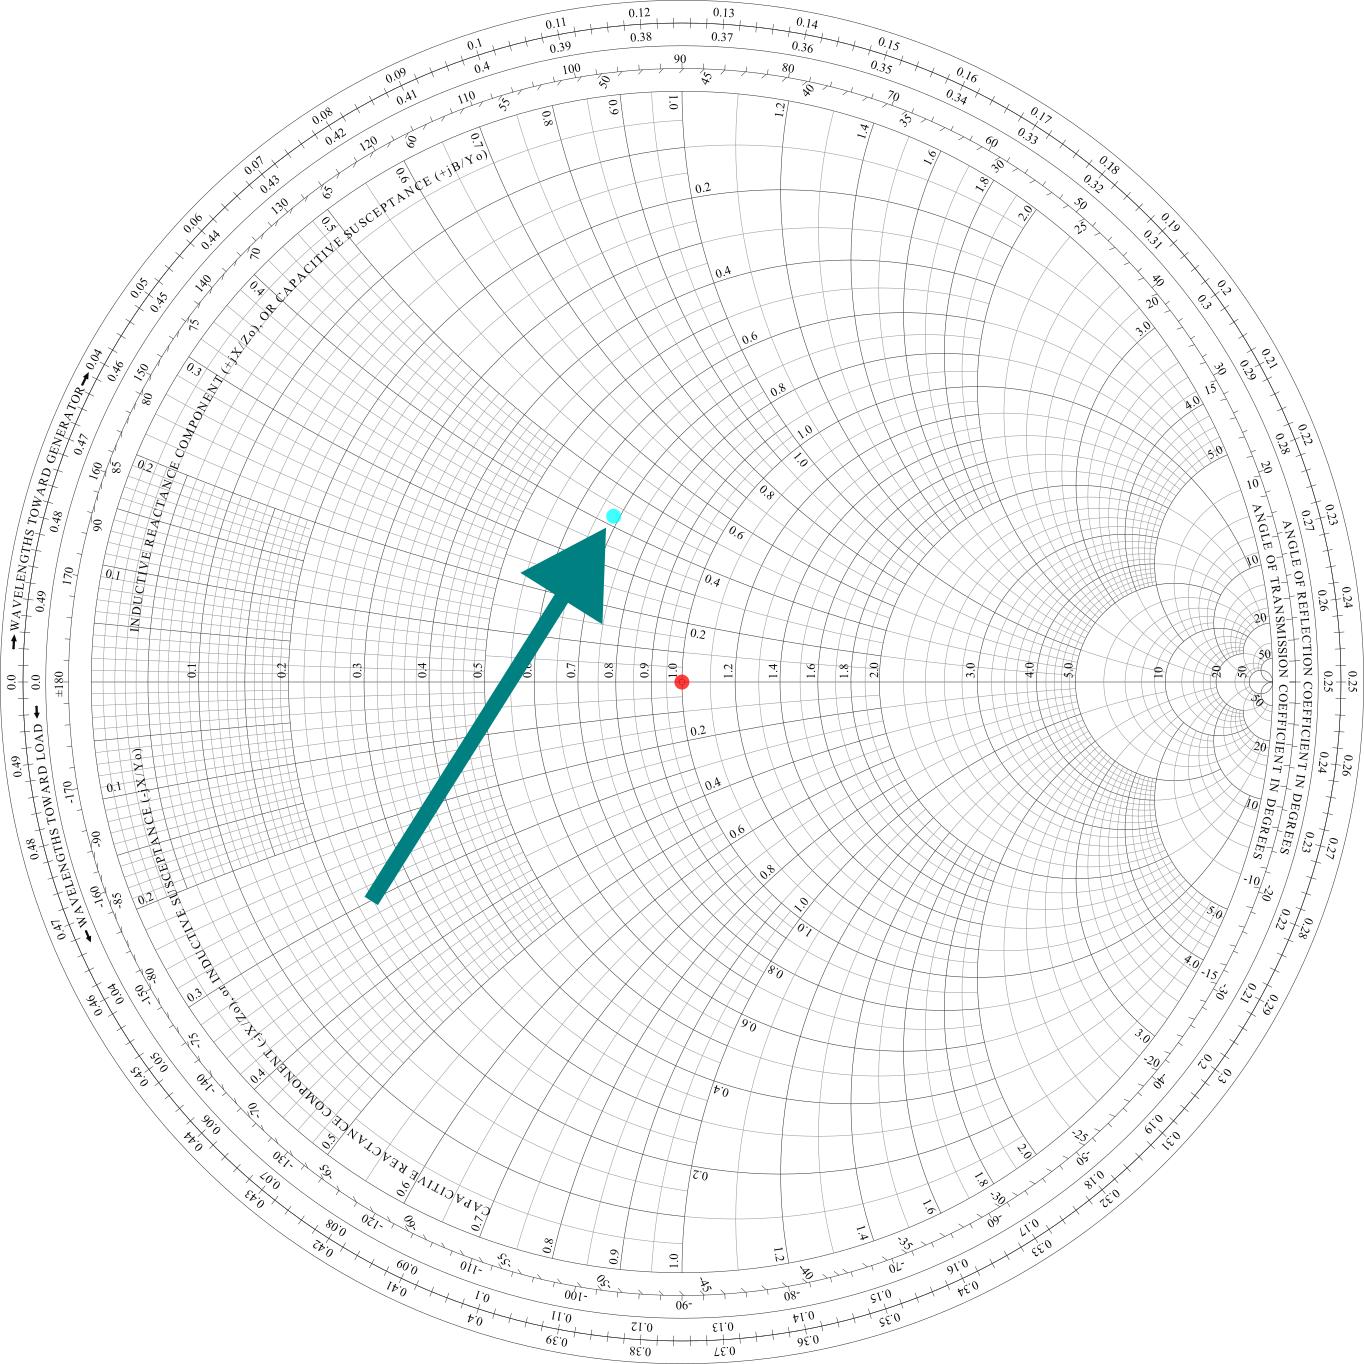
Now, you seem to be familiar with the fact that a mismatch (in this case, between 50 Ω and (36.5 + j21.25) Ω, or equivalently between 1 and 0.73 + j0.425) leads to reflections.
But what happens now when these reflections travel back on the 50 Ω cable that the antenna was connected with towards the amplifier? Their phase shifts. We know by how much – each wavelength (in the cable) by a full $2\pi$ cycle, and proportionally less for shorter cables. (And full multiples of wavelengths of lossless cable make no difference at all, so we only look at the fractions of a wavelength.)
We can actually do that in the Smith chart: simulate the effect of a piece of coax at the characteristic impedance of our system.
That happens by taking a compass, and drawing a circle, centered on the reference impedance "1.0" through the point. (we call that circle a SWR circle, because the standing wave ratio remains the same for all points on that circle) A full walk around the circle is worth half a wavelength, so we ignore all multiples of half a wavelength.
Let's get back to our quarter-wavelength monopole and connect it with a $2.7\lambda$ long cable. $2.7\lambda$ is $2.5\lambda$ (so, five half-wavelengths) plus $0.2\lambda$. So, we walk 0.2/0.5 = 0.4 of a full circle:
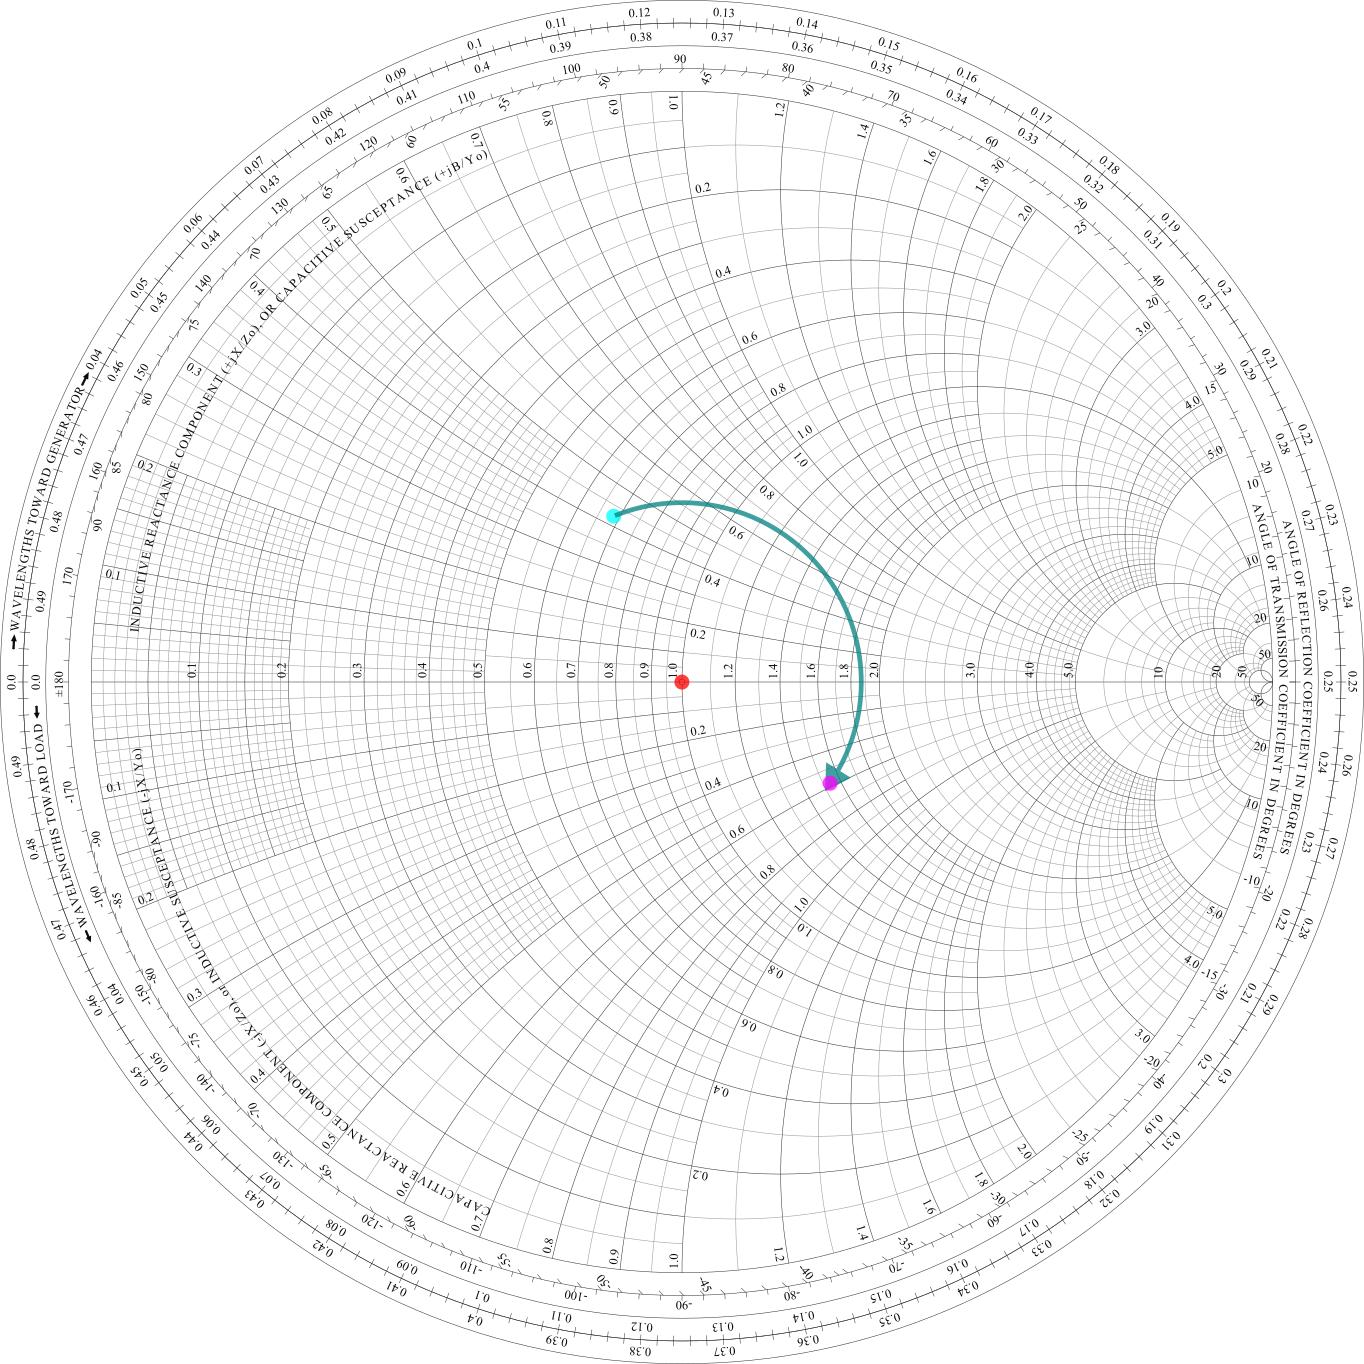
So, wait? We just took one impedance, attached a piece of cable to it, and got a completely different one, including a method how to determine what we get?
Yes:
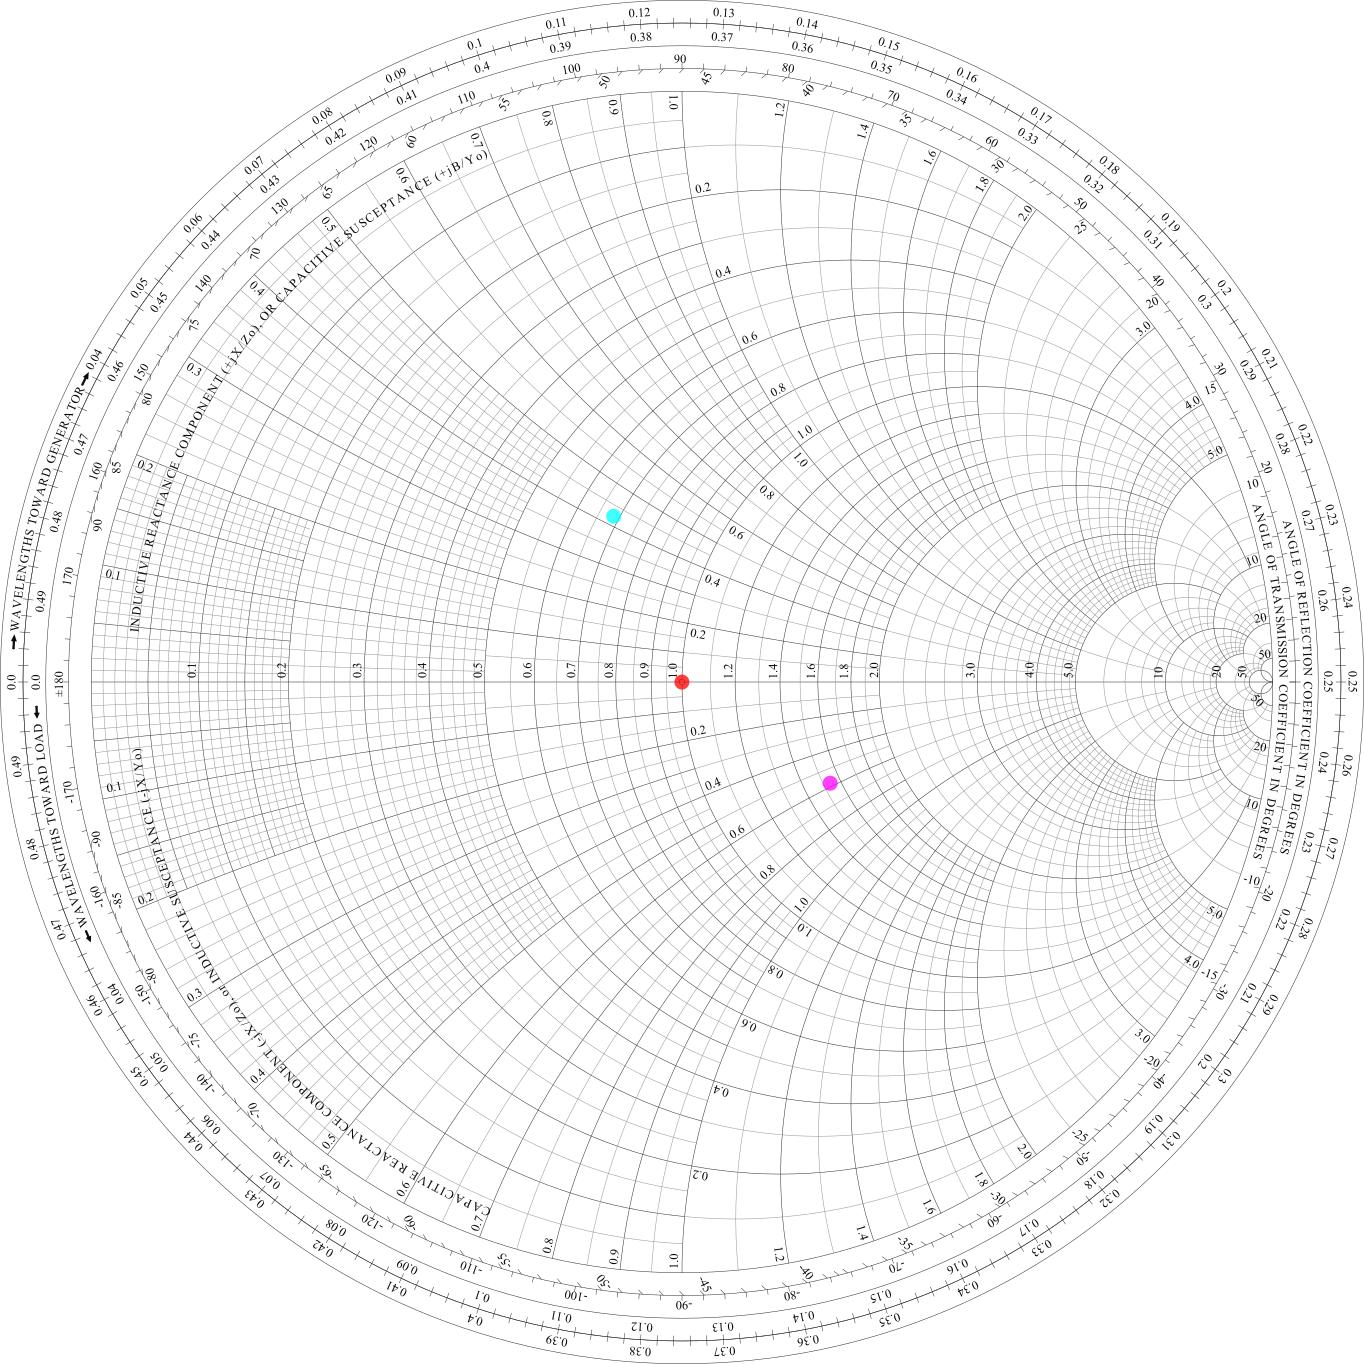
We have taken the slightly beastly-impedance antenna (cyan dot), transformed it with a piece of transmission line to a different impedance (magenta dot).
We can repeat that with other pieces than just transmission lines. For example, we can add inductors in series to make the magenta dot "walk up" on one of the complex circles until it hits the real axis again (in our case, that point would be ca 1.55), and then use a transformer with an appropriate winding relation (eg. 20:31) to transform the impedance to the system impedance of 1 (so, 50 Ω).
Brilliant. We just learned how to predict what a piece of cable will do to the impedance of an antenna from the point of view of our amplifier; we also learned a methodology for matching arbitrary antennas: add capacitors or inductors to walk on the circles that are already drawn in the Smith chart, and use pieces of transmission line to walk on circle around the center.
Things get better from here – there's the same thing, but not for impedances but admittances (an admittance is the inverse to an impedance, just as conductivity is the the inverse of resistance). With that, we can also represent components that are in parallel instead of in series with the current point. So, you can fully represent the working of an LC matching circuit through walking the appropriate circular lines in a Smith chart!
[Bal05] Balanis, Constantine A.: Antenna Theory Analysis and Design. 3rd edition, 2005. Might be cheaply available through the used textbook market, on abebooks.com or amazon.com


