0
$\begingroup$

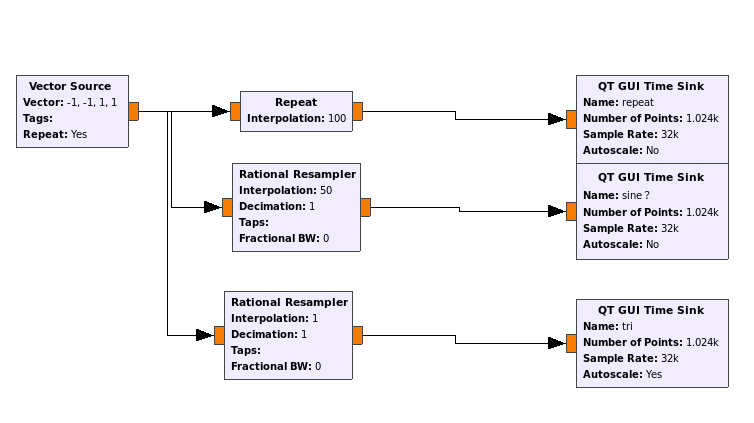
Flow graph in Gnuradio as below:
enter image description here

Before running this flow, I think "interpolation 1" and "decimation 1" won't change the signal.

And, I can't image how "Rational Resampler" changed vector -1,-1,1,1 to "sine" wave.

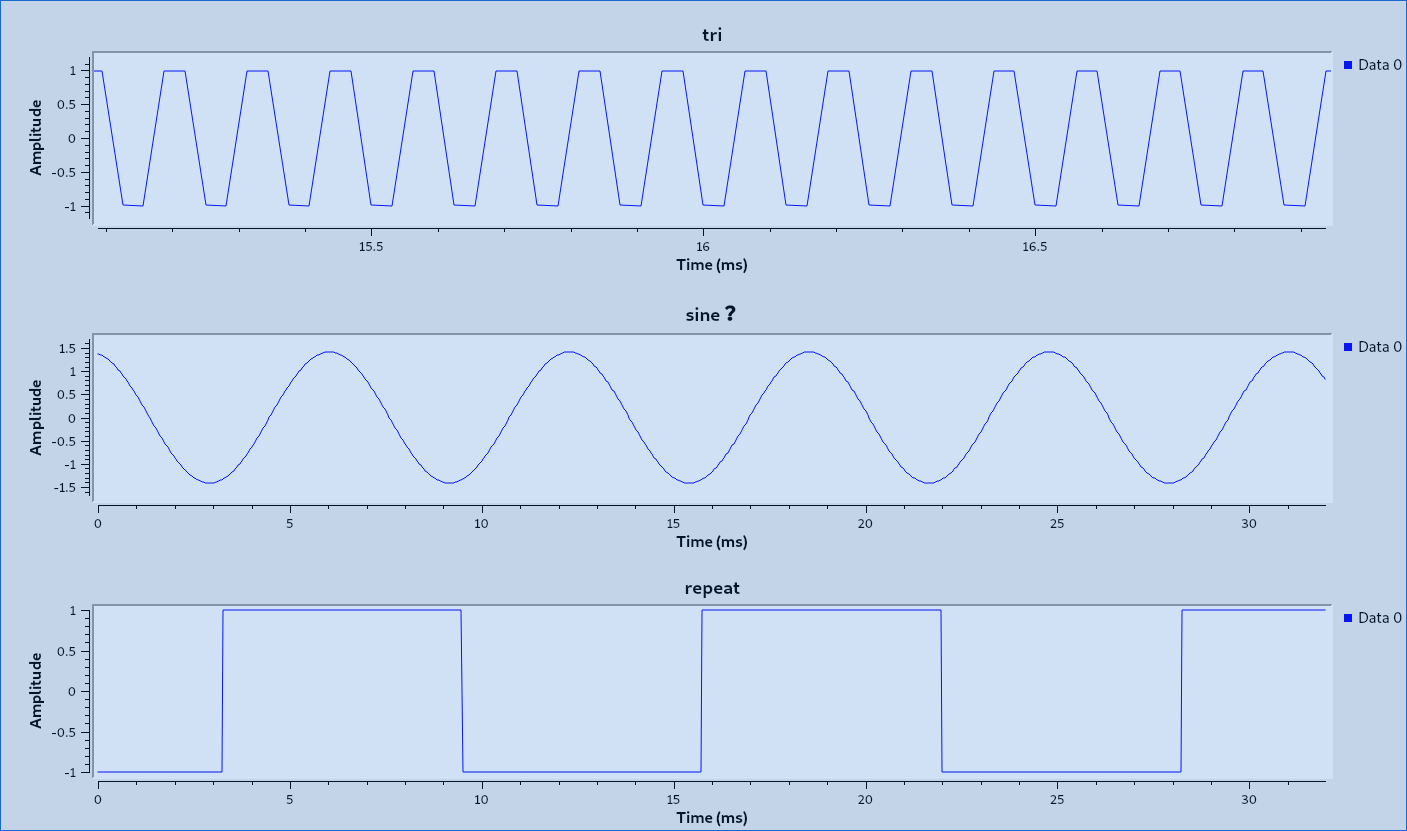
The final output is below:
enter image description here

How did "Rational Resampler" change the type of wave?

$\endgroup$
8
  • $\begingroup$ It's not clear what you mean with "to change the wave format". you need to clearly define what you want to achieve. $\endgroup$ Commented Sep 3, 2021 at 16:07
  • $\begingroup$ I mean the type of wave ,such as sine,rectangle. $\endgroup$
    – kittygirl
    Commented Sep 3, 2021 at 16:15
  • $\begingroup$ that makes little sense in presence of a discrete signal; for example: $-1, +1, -1, +1, -1, ..$ is a discrete sine. And a diskrete rectangle wave. And a discrete triangle wave. What is it that you actually need! Ask a single, precise question, please. $\endgroup$ Commented Sep 3, 2021 at 16:18
  • $\begingroup$ Is -1,-1,1,1... discrete sine? $\endgroup$
    – kittygirl
    Commented Sep 3, 2021 at 16:34
  • $\begingroup$ As -1,-1,1,1 has only 2 values,how could it be resampled to more values then shape the sine? $\endgroup$
    – kittygirl
    Commented Sep 3, 2021 at 16:36

2 Answers 2

1
$\begingroup$

vector -1,-1,1,1 is in fact an discrete sine wave (appropriately scaled and phase-shifted), with a frequency of 0.25 cycles per sample:

$$ \begin{align} f(n) &= \sqrt{2} \sin\left(0.25\cdot 2\pi n + {5\pi \over 2} \right) \\ f(0) &= -1 \\ f(1) &= -1 \\ f(2) &= 1 \\ f(3) &= 1 \end{align} $$

It's not a square wave but let's suppose it is. A square wave consists of a fundamental and odd harmonics. So if we took the fourier transform of this square wave, it would have a fundamental at 0.25 cycles/sample, and a harmonic at 0.25*3 = 0.75 cycles/sample.

But 0.75 cycles/sample is greater than the nyquist frequency of 0.5 cycles/sample. This harmonic can't be represented at this sample rate. Therefore by contradiction the source is not a square wave.

In fact, to even begin to represent a square wave, it must have a fundamental frequency strictly less than 0.5 / 3 = 0.16666 cycles / sample, otherwise none of the harmonics can be represented. A square wave without any harmonics is just a sine wave.

As you've seen, viewing discrete waveforms in the time sink can be a little misleading because by default it connects each sample with a straight line. You could consider changing the settings to draw just the points, which can be a little less misleading but also sometimes harder to read.
$\endgroup$
2
  • $\begingroup$ How to change the setting to draw just the points? $\endgroup$
    – kittygirl
    Commented Sep 3, 2021 at 18:38
  • 1
    $\begingroup$ @kittygirl I don't have GRC in front of me, but IIRC you can right click it and there's "interpolation" or "display" or something in the menu. $\endgroup$ Commented Sep 3, 2021 at 19:07
1
$\begingroup$

A (non-undersampling) resampler usually assumes that the total signal represented by the original samples is baseband bandlimited (perfectly low-pass filtered), and thus contains no frequency spectrum above half the sample rate. Any spectrum (at or) above half the sample rate usually just creates aliasing noise (unless purposefully undersampling).

A square wave contains lots of higher frequency odd harmonics (a theoretically infinite number for an ideal perfect square wave). Look at the Fourier transform of a square wave to confirm this.

When all those odd harmonics are removed (or assumed not to exist) by the resampler before resampling the assumed original bandlimited signal, what you have left (depending on the original sample rate) might be only the fundamental frequency sine wave, which has a higher amplitude than any original square wave.

You original graph shows a square wave because it used linear interpolation between points, and thus not only did not remove any high frequencies, but likely added them due to a non-bandlimited plotting interpolation, and thus is showing a signal that is not correctly representative of a (commonly) baseband bandlimited signal that was sampled.

Plot with a Sinc interpolation, and you will see a sinewave.

$\endgroup$
20
  • 1
    $\begingroup$ I am not referencing the original graph. I am referencing the (often) incorrect assumption that this is the graph of a (improperly sampled) square wave. $\endgroup$
    – hotpaw2
    Commented Sep 3, 2021 at 19:32
  • 1
    $\begingroup$ In any case, your final paragraph suggests there are harmonics that weren't removed, but my point is there never were any harmonics to be removed. The source (a repeating -1, -1, 1, 1) has no harmonics to be removed! $\endgroup$ Commented Sep 3, 2021 at 20:37
  • 1
    $\begingroup$ You're making a Russel's teapot argument. Sure, maybe there existed at some point some waveform which consisted only of the one frequency in -1, -1, 1, 1 or image frequencies thereof, but there is no way to interpret that sequence of samples to show that those harmonics existed. Any information of their existence has been lost, irrevocably. You're talking about divination, not assumption. And in this example, we can plainly see the source is not an undersampled signal. It is literally the sequence -1, -1, 1, 1, repeating, no more and no less. It's right there, at the left of the graph. $\endgroup$ Commented Sep 3, 2021 at 21:48
  • 1
    $\begingroup$ Good for you. Unfortunately implicitly questioning my qualifications does not change the fact that there are no harmonics in the discrete Fourier transform of -1, -1, 1, 1. I guess your point is maybe harmonics existed in some signal not show or even implied, but all information about them removed by some unseen process that quite clearly isn't in the question at all. That's true, I guess? I don't see how this is useful or relevant. $\endgroup$ Commented Sep 3, 2021 at 22:07
  • 1
    $\begingroup$ It only represents infinite harmonics if you are trying to infer the existence of some analog signal that has been sampled. A discrete function is a perfectly valid thing to interpret unambiguously in its own right, and since the question doesn't ask about or imply the existence of anything else, I really don't see how the point you are making is relevant. If this is really the hill you want to die on, you should also make the point that the middle waveform labeled "sine ?" is exactly as much maybe not a sine as the one labeled "tri". $\endgroup$ Commented Sep 3, 2021 at 22:13

You must log in to answer this question.

Not the answer you're looking for? Browse other questions tagged .