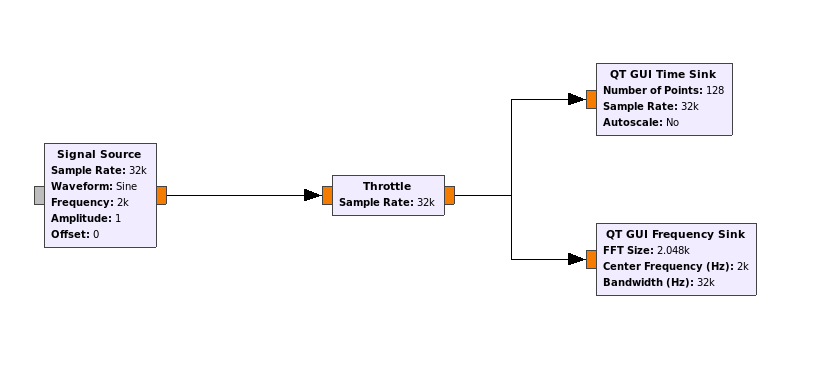
I constructed the flow graph in GNUradio 3.7 as below:

I know a sine wave has only one frequency, so what causes the frequency sink to show two peaks?
I constructed the flow graph in GNUradio 3.7 as below:

I know a sine wave has only one frequency, so what causes the frequency sink to show two peaks?
Because mathematically, a function like $\sin(\omega t)$ has an angular frequency of $\omega$ and $-\omega$. Consider:
$$ e^{i\omega t} + e^{-i\omega t} $$
By Euler's formula this can be expanded to:
$$ \cos(\omega t)+i\sin(\omega t) + \cos(-\omega t)+i\sin(-\omega t) $$
By the trig identity $\sin(x) + \sin(-x) = 0$ this simplifies to:
$$ \cos(\omega t)+ \cos(-\omega t) $$
And because $\cos(-x) = \cos(x)$ it further simplifies to:
$$ e^{i\omega t} + e^{-i\omega t} = 2 \cos (\omega t) $$
Now, what does the GUI frequency sink do? It calculates the discrete Fourier transform, which essentially asks, "how much does this signal look like $e^{i\omega t}$?" for every frequency ($\omega$) from -0.5 cycles per sample to 0.5 cycles per sample.
Finally, it draws a scale on the bottom of the chart based only on what you've entered in the "bandwidth" and "center frequency" parameters which have nothing to do with the frequency unless you enter the correct parameters here. In your case you've entered 2k for the center frequency, which is incorrect. You haven't done anything in the flow graph to shift the frequency up or down, so the center frequency should remain at 0.
With the correct center frequency configured in the GUI sink, it would be telling you there's a peak at -2kHz and 2kHz, which is correct.
Why? Because your input signal is a real function: there are no imaginary numbers. The only way to cancel the $i$ in Euler's formula is for every positive frequency to have a negative frequency of equal amplitude and phase. Therefore, the discrete Fourier transform (what's shown on the GUI sink) will be a mirror image for any real function.
Because of this, for a real function the negative half of the discrete Fourier transform doesn't really tell you anything. It's a common enough case that within the setting for the GUI sink there's an option to hide it.
real sine function and complex sine function?In real radio world,do we have real sine signal?
$\endgroup$
Commented
Sep 2, 2021 at 19:50
The output of the FFT you used is complex. When you input a strictly real signal to a FFT that produces a complex result, half of the complex result is the complex conjugate of the other half (this gets rid of all the unwanted imaginary components, when everything is summed up), mirrored.
When you display only the magnitudes in an FFT plot, a complex conjugate mirrored pair looks like two copies of your signal (each side with half the amplitude).
You also specified a shift of 2k in your FFT sink, by specifying a center frequency of other than zero. Why? I don't know. But it makes all the X axis labels off by 2k.
center frequency as peak frequency,then specifying a center frequency of other than zero.I will keep in mind keep center frequency zero. Is there any counter example need to specifying a center frequency of other than zero?
$\endgroup$
Commented
Sep 2, 2021 at 19:34