Bottom line is I have got a very strange (but regular) reading on a < $1 type of ASK 433 MHz receiver. Have a look at it - those 3 spikes are sometimes caught by my receiver, don't know their source. But I am curious as to what they might be produced by. They don't quite look as they were carrying much information.
2 Answers
That's impossible to tell. An ASK receiver will only see amplitude (or rather: envelope) – that's its job.
Now, signals exist with modulated phase, too, not to mention that if you do a frequency modulation, the amplitude seen by an ASK detector will look strange.
What you'd need to do is look at the raw signal (at 433MHz +- signal bandwidth/2) or look at an equivalent intermediate frequency signal (IF +- bandwidth/2) or, most easily, at an equivalen complex baseband signal (+- bandwidth/2). Those fully capture what the signal actually does (rather than just reduce the signal to its amplitude/envelope).
Essentially, if you do that with a PC, you'd have Software Defined Radio (SDR). I think the cheap less-than $30 RTL-SDR dongles will do pretty nicely for that purpose.
Good news, everyone!
So you've got an SDR device – a RTL dongle, and now would like to use it to analyze signal?
Now, I must admit that I'm not that much of a guy that handles overly many computer operating systems – whenever I can, I try to take "my setup" with me. So that's what I'll do here:
- Get the GNU Radio live SDR environment image. It's a bootable DVD image – you can thus directly burn it to a DVD (don't drop it as a file onto the DVD, but burn it as image), or use tools like Rawrite32 to write it to a >= 4GB USB drive.
- Boot from that medium
- Connect your RTL dongle :)
GQRX-based recording
- Run GQRX; it should start with something like:
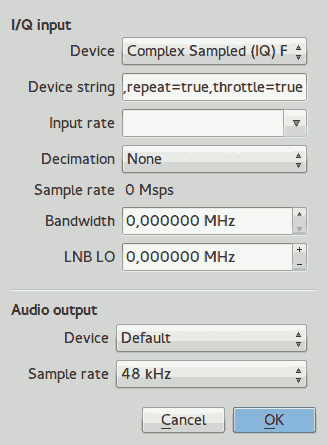
- Under "Device" look for "Realtek RTL…" and select that
- "OK" this dialog away
- You'll be greeted by a window looking like this:
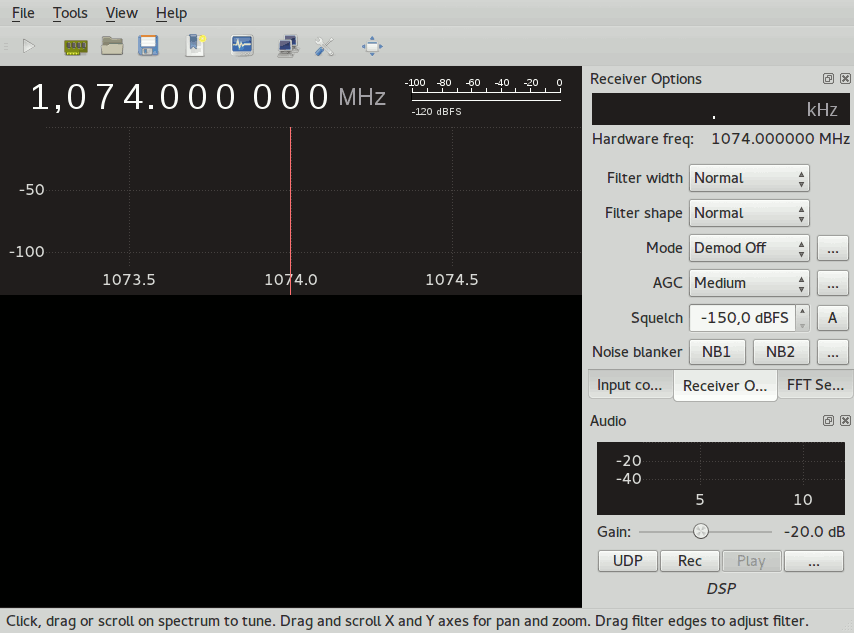
- you can now start the reception by clicking on the highlighted button

- you'll now see a waterfall scroll by, and the momentary spectrum in the top of the window. Adjust your frequency till you can see your signal of interest in the waterfall. I jumped to 666 MHz just to have something to show:
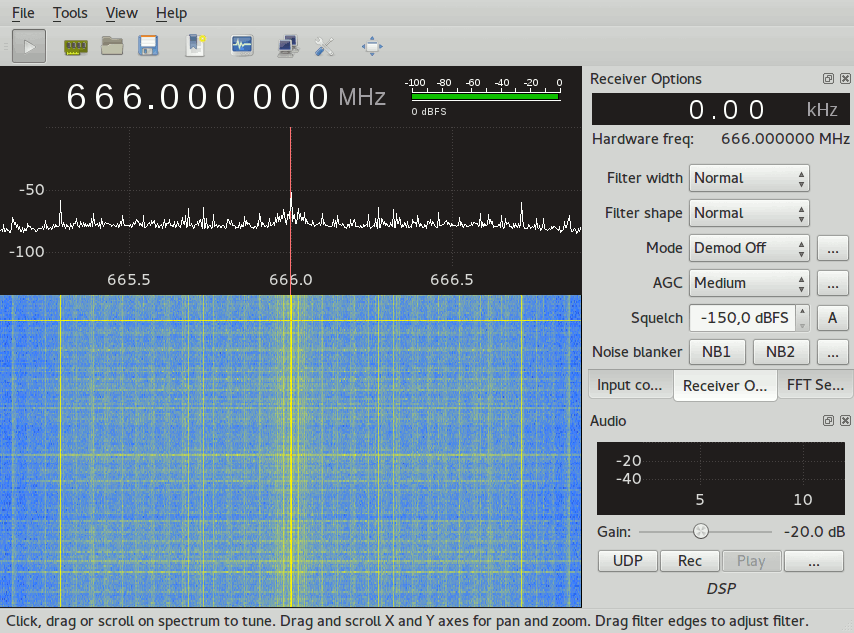
- click on the recording button:

- you're greeted by a window:
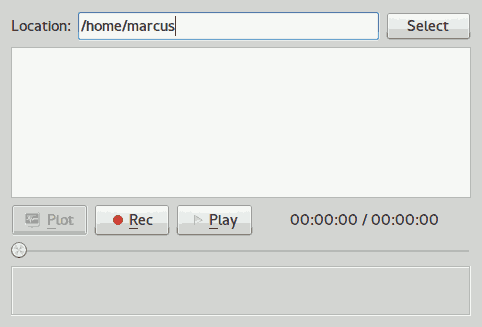
- here you can click on the
recbutton to make a recording in the specified folder.
- you can now start the reception by clicking on the highlighted button
- With the recording from GQRX, you can then feed offline analysis tools like audacity (File->Import->Raw Data->pick your recording->32bit float, little-endian,2 channels)
live analysi
Alternatively, you can also directly do this analysis from within the GNU Radio companion. On the desktop, click the GNU Radio Companion logo.
- You're greeted by a window looking somewhat like this:
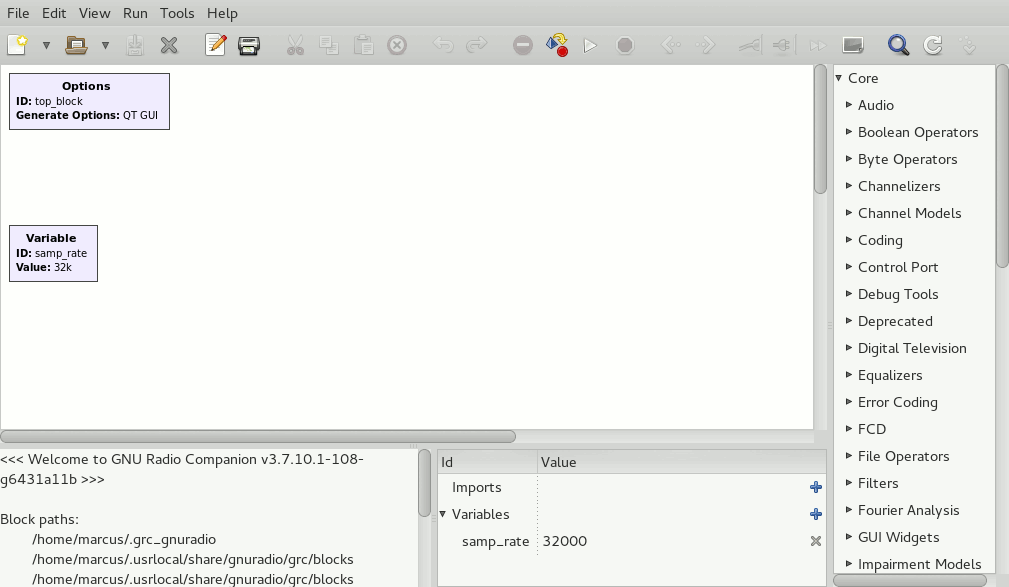
- click the magnifying glass to activate the search function.
- Look for the "osmocom source". Drag that onto the canvas:
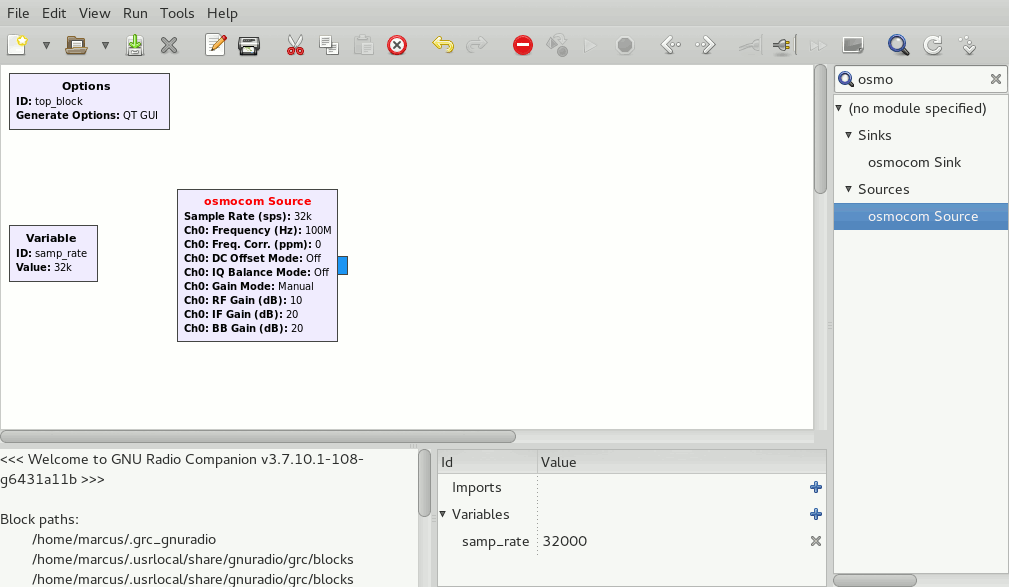
- Now, obviously, our sampling rate is not what we want. Double click on the "samp_rate" Variable:
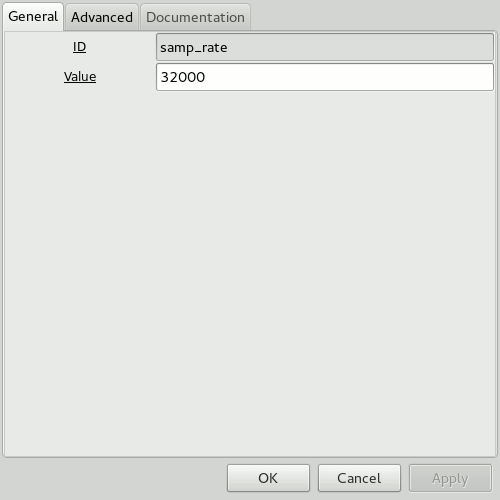
- Change "32000" to "2e6". 2MHz seems like a nice sampling rate. Close the variable property window.
- Now, add a slider that allows us to change the center frequency on the run: search for "range" in the block list again. Add at "QT GUI Range" to the canvas. Double click it to change its properties:
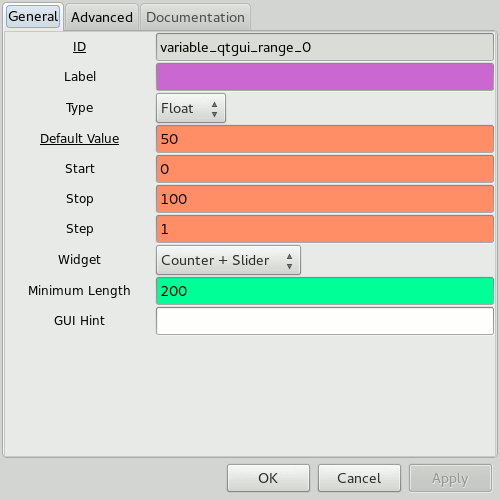
should be modified to read
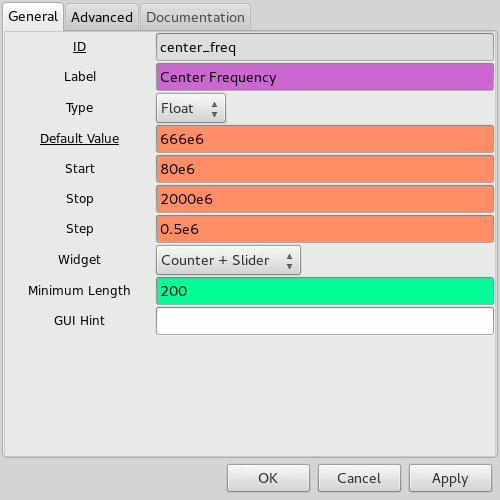
- Click ok, double click on the osmocom source. For now, just use
center_freq(the ID of our slider!) in the "Ch0: Frequency (Hz)" field: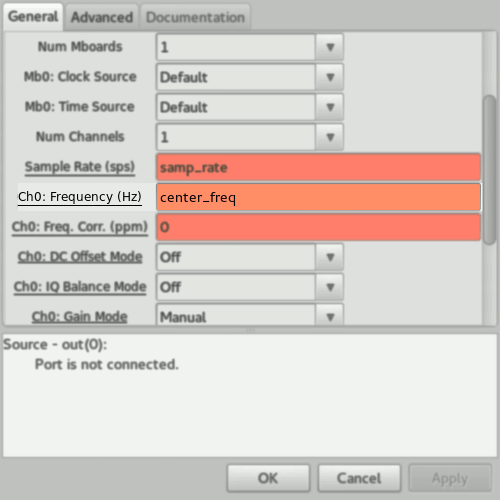
- Now comes the fun part: search for "time sink" and "frequency sink" in the block list. Add both to your flow graph:
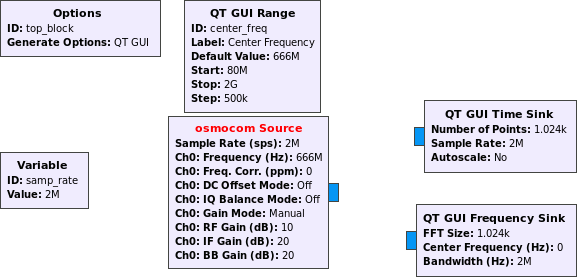
- Click on the output port of the osmocom source and the QT GUI Time Sink. A connection between them appears. Repeat with osmocom source and QT GUI Frequency sink:
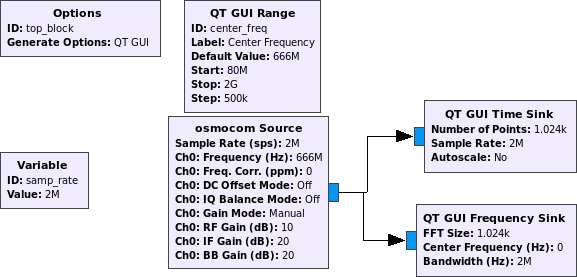
- Double click the Frequency sink, and use
center_freqin the "Center Frequency (Hz)" field. - We're ready to go! Hit the the "execute button":

- Because you haven't saved before, you'll be asked to enter a file name. Choose whatever you like. OK.
- TADAAA! Instant live display of your signal :)
You might want to close the display and go back and increase the BB and RF gain in the osmocom source. Adjust to your liking, or add another slider to make it run-time adjustable!
-
$\begingroup$ Hey, I have a new toy on my desk. It is a an RTL-SDR. Being the noob that I am, some pointers on how to achieve listening
most easily, at an equivalen complex baseband signal (+- bandwidth/2).would come in handy. I am on Win32 soo.. CubicSDR, SDR# ? $\endgroup$– kellogsCommented Dec 15, 2016 at 10:10 -
1$\begingroup$ Cool new toy! What the RTL dongle gives you is always complex baseband. I'm really not versed with what the Windows software does, to be honest. But I've just looked online and it seems SDR# has a way of recording the original raw IQ data – if it didn't, your installation might still have the
rtl_sdrcommand line tool that can directly record signal to file without any GUI $\endgroup$ Commented Dec 15, 2016 at 10:28 -
$\begingroup$ In any case, you'd then have a recording (might be important to note down what file format it uses –
rtl_sdruses 8 bit signed integer complex format, I don't know about SDR#) . $\endgroup$ Commented Dec 15, 2016 at 10:30 -
$\begingroup$ I'd have another that hopefully makes this easier for you – give me a second, I'll add that to my answer! $\endgroup$ Commented Dec 15, 2016 at 10:31
-
1$\begingroup$ @kellogs puh, that was a monster of an edit! Hope you like it :) $\endgroup$ Commented Dec 15, 2016 at 22:44
I think you're asking if you the simple-looking spikes occurring after the ASK transmissions are a different mode being picked up.
I am quite confident they are not — rather, they are part of the end of the signal from the ASK transmitter. Note that they always occur with a specific time after the end of the ASK transmission — this is plenty of evidence by itself.
More speculatively:
They have a classic exponential-decay shape, which is likely not actually part of the transmitted signal but the result of a DC-blocking filter (coupling capacitor) somewhere in your receive path. Therefore I hypothesize that your waveform is inverted polarity (greater amplitude lower on the display) and the transmitter is remaining active for a while after the modulated data ends and the separated spike is the true end of the signal. If the spikes are sometimes absent, that might be due to the data ending with a 0 instead of a 1 or vice versa and the transmitter just happening to extend the last bit.
As Marcus Müller mentioned, you can get a better picture by using a SDR receiver which records the entire input instead of just the amplitude. Avoiding the DC-blocking filter would also make it clearer by letting you see absolute signal magnitudes instead of just edges (but that's not useful for actually demodulating the intended signal, just for understanding).
