1
$\begingroup$

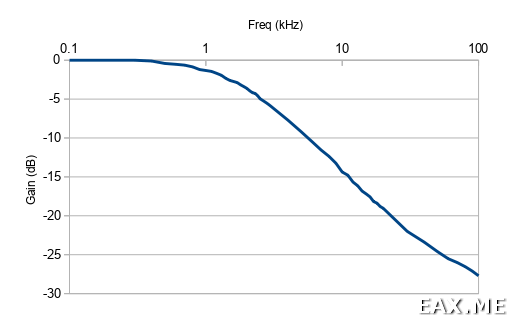
I would like to have a convenient tool to measure filters and amplifiers in 20 Hz - 20 kHz frequency range. Currently I'm doing this with a signal generator, an oscilloscope and LibreOffice. It's not the fastest and not the most convenient method, but it gives a nice looking result:

enter image description here

I've tried several software solutions for my primary OS, which is MacOS. The closest things I could find were iSpectrum and Friture, but they don't do exactly what I wanted to. I couldn't find a way to determine a 0 dB reference. I also tried to run several Windows tools using CrossOver - some of them didn't work, some were no better than Friture.

I very much like my Rigol DSA815-TG. But the problem is that it doesn't work well below 9 kHz and is completely deaf below 1 kHz. I tried to use a diode ring mixer to upconvert the frequencies of interest above, say, 10 Mhz. It works, but this mapping turns out to be non-linear. I.e. 1 dB change in DUT frequency response doesn't cause 1 dB change on upconverted frequencies. This is actually to be expected, since audio devices are usually not matched to 50 Ohm. It means that I have to design some sort of compensation network to make this work. This starts to sound complicated.

In theory I could also write a little piece of software for STM32 microcontroller to automate the task.

Basically what I'm looking for is a frequency analyzer, but for low frequencies. Or like HP 35660A dynamic signal analyzer, but for a resonable price.

I find it hard to belive that I'm the first one who encountered this issue. Is there really no software, no open source MCU based project and no upconverter that already make plots like the one shown above?
$\endgroup$
2
  • 2
    $\begingroup$ Does it really need to go all the way to DC? Or would 20 - 20,000 Hz be good enough? Also how much do you care about accuracy? $\endgroup$ Commented Aug 23, 2020 at 3:53
  • 1
    $\begingroup$ 20+ Hz will be OK. I don't care that much about accuracy, something like +/- 0.5 dB will do. $\endgroup$ Commented Aug 23, 2020 at 7:31

1 Answer 1

8
$\begingroup$

So, requirements:

  • runs on OS X and windows
  • easy to work with
  • quicker than "tone and excel" method

If you don't like writing software yourself, this should still be pretty doable with just your soundcard and a quick signal flow graph design (in GNU Radio Companion) of your own.

So, first off: Exciting with a single tone and stepping through all frequencies is fine. But a lot of work.

The linearity of the Fourier transform says that

  1. if you feed a single tone into a system that is linear (e.g. a filter), you will only get that tone out
  2. you can either
  • take one tone, observe how it gets attenuated (and phase shifted) by your linear system, then move up to the next tone, and so on, and then add everything up, OR,
  • take all the tones at once, and observe which frequency gets attenuated how.

The second part tends to be quicker :)

So, without much ado: here's what it'd look like to me:

flow graph

The low-pass filter is optional and just there because my experience tells me you want one sooner or later.

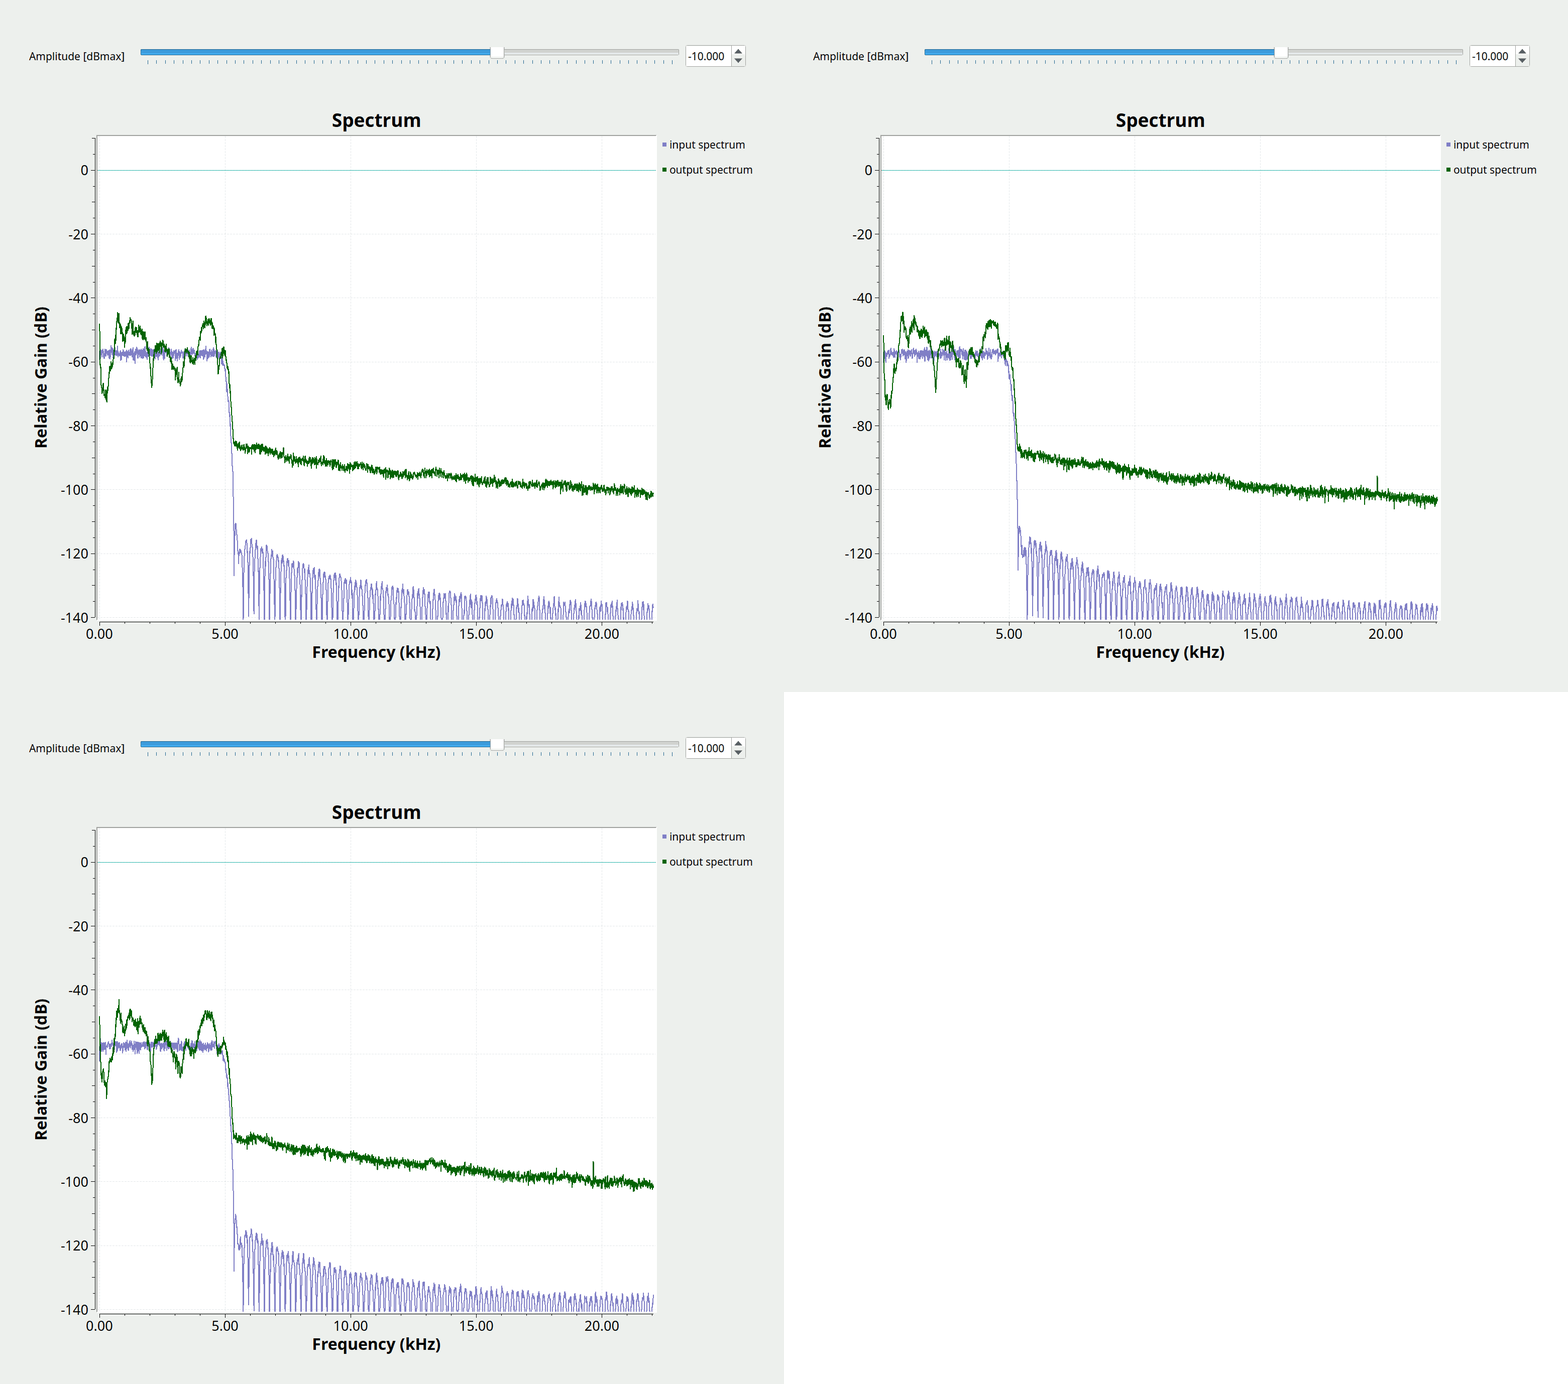
When run (purely with my laptop speakers and microphone, outdoors, lots of noise around me) that's what it looks like:

Running program

The soundcard plays the blue line, to the best of its abilities. It digitizes the microphone audio, which yields the green line.

"To the best of its abilities" is of course an important thing here: This needs calibration. Sound cards aren't flat in frequency, because a) that's expensive to build and b) that doesn't help human hearing find things pleasurable.

So, you'd

  1. run with a simple cable loopback, so that you get the frequency response of your sound card. (Save the image for later: click with your middle mouse button on the graph, "save image")
  2. run with your filter-under-test between soundcard input and output. Subtract the dB values from previous cable calibration from each point.

That gives you a nice, normalized frequency response: if your filter is the perfect lossless all-pass (just like your cable), then you'd be getting 0 dB at all frequencies. The frequencies where it attenuates, you get exactly the attenuation, where it resonates, you'll see the gain.


Indeed, the manual calibration (i.e. point-wise subtraction) step is ... annoying. If your soundcard has two input channels, which are well-isolated from each other (my laptop doesn't), then you could also connect your sound card output to loopback cable and device under test in parallel, and each to their own sound card inputs. Then, you could modify the above to calculate the logarithmic power from each channel, and subtract the calibration channel data from the measurement channel and get the calibrated result right away.

I couldn't test this with my laptop, so I didn't test it for you, but it'd be relatively simple and look like this:

normalized/calibrating soundcard sounder

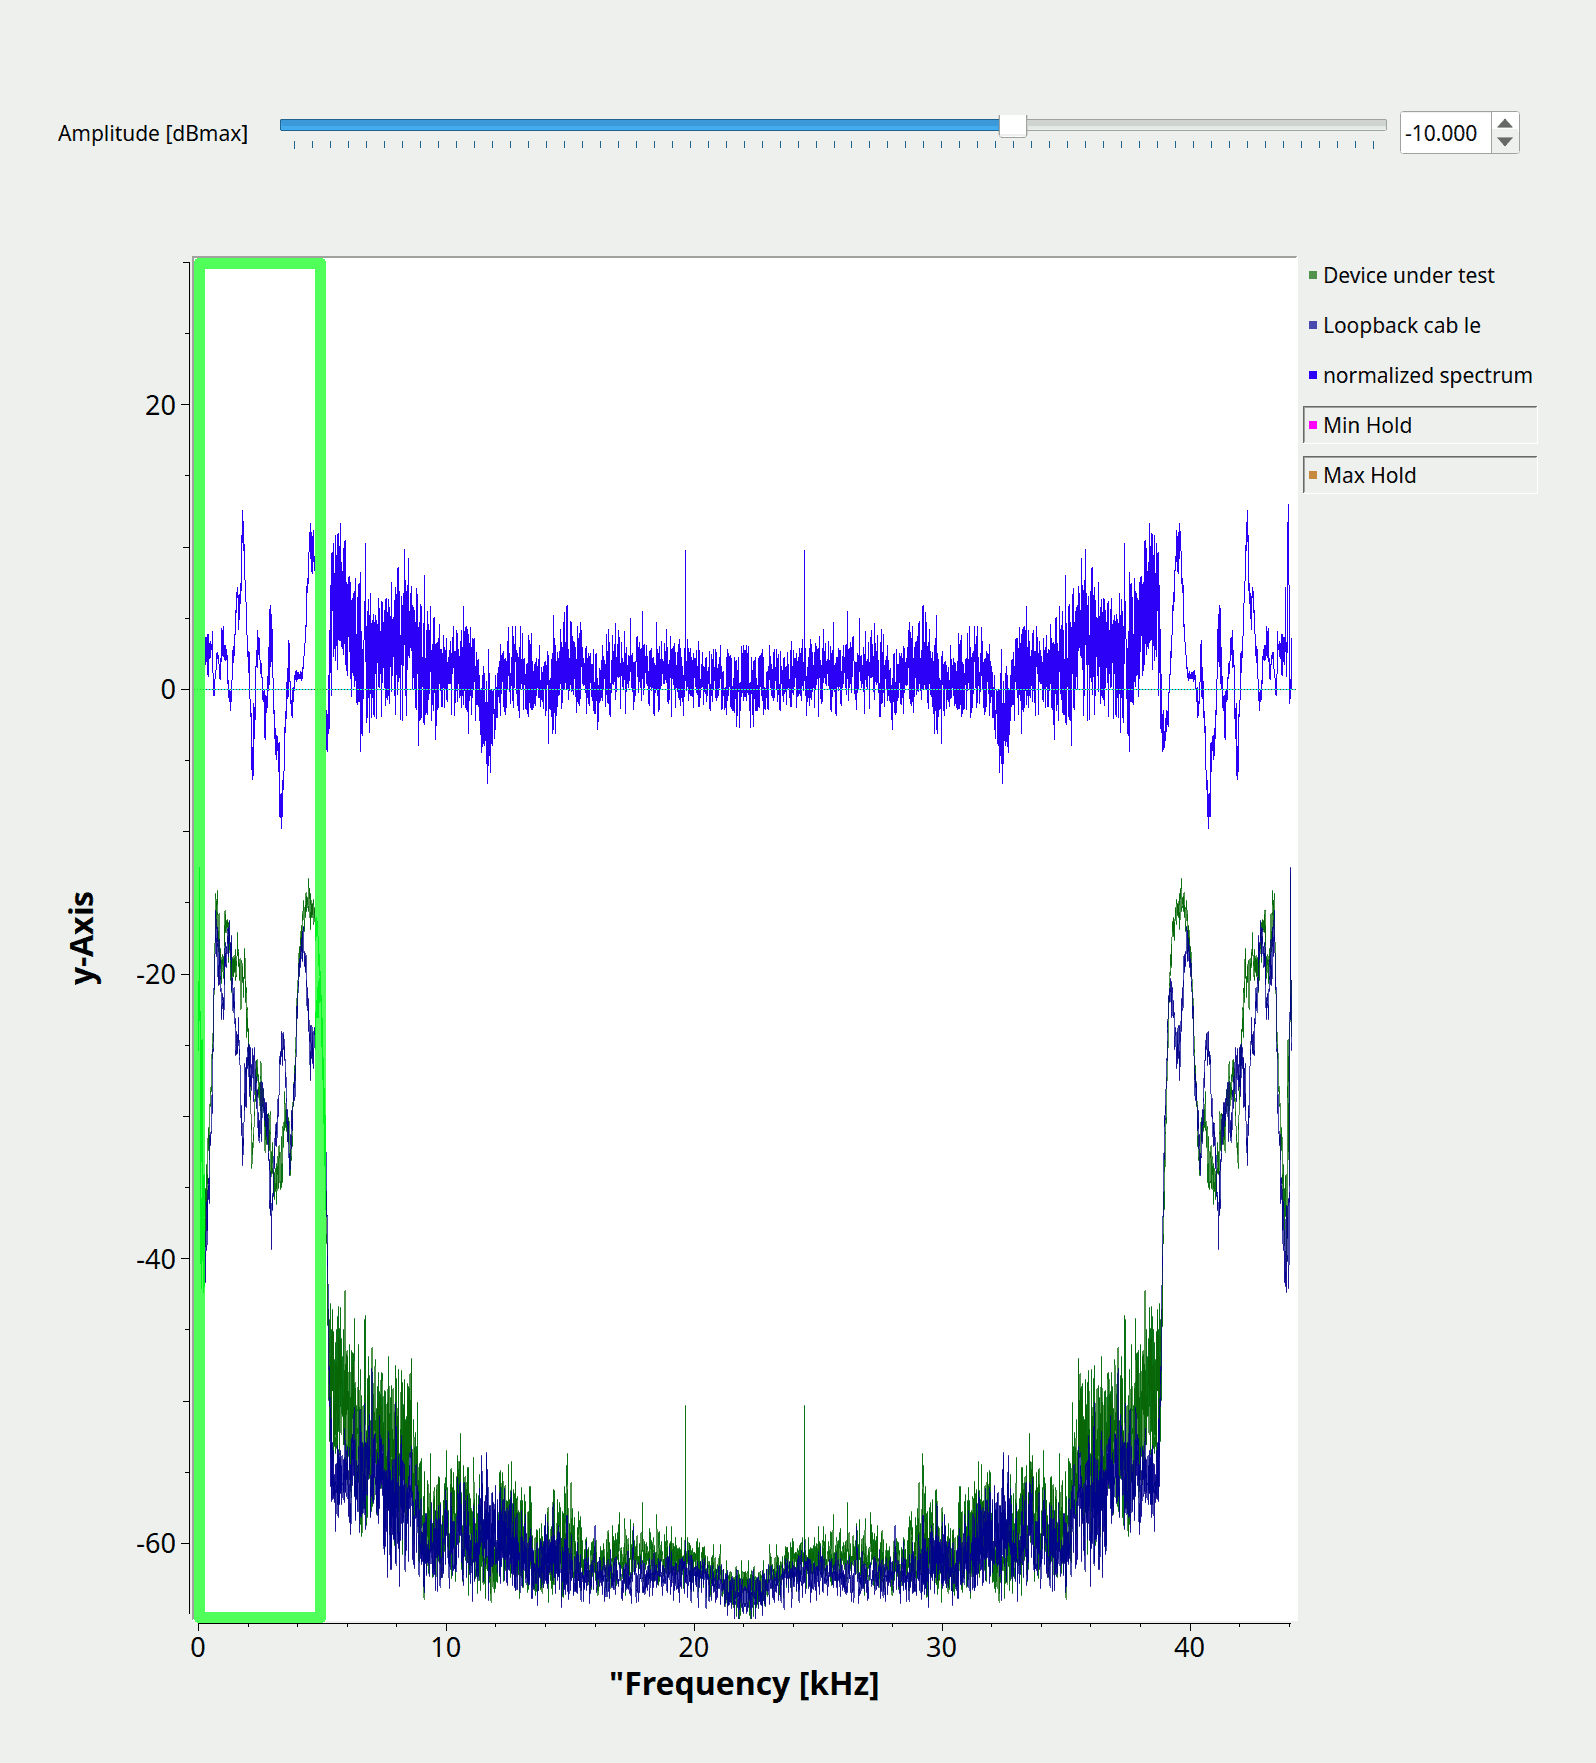
and the output would look like (I tried to highlight in green the area you need to look at; the rest is just noise, because we're suppressing the output signal with the low-pass filter everywhere else). Again, this isn't what a filter response would look like if you measured it with the method (sound card output-> Device under test -> left sound card input; sound card output -> cable -> right sound card input), because this is just "sound over the air with birds", but I think a picture still helps understand what's happening here:

Differential Channel Sounder Display

$\endgroup$
0

You must log in to answer this question.

Not the answer you're looking for? Browse other questions tagged .