5
$\begingroup$

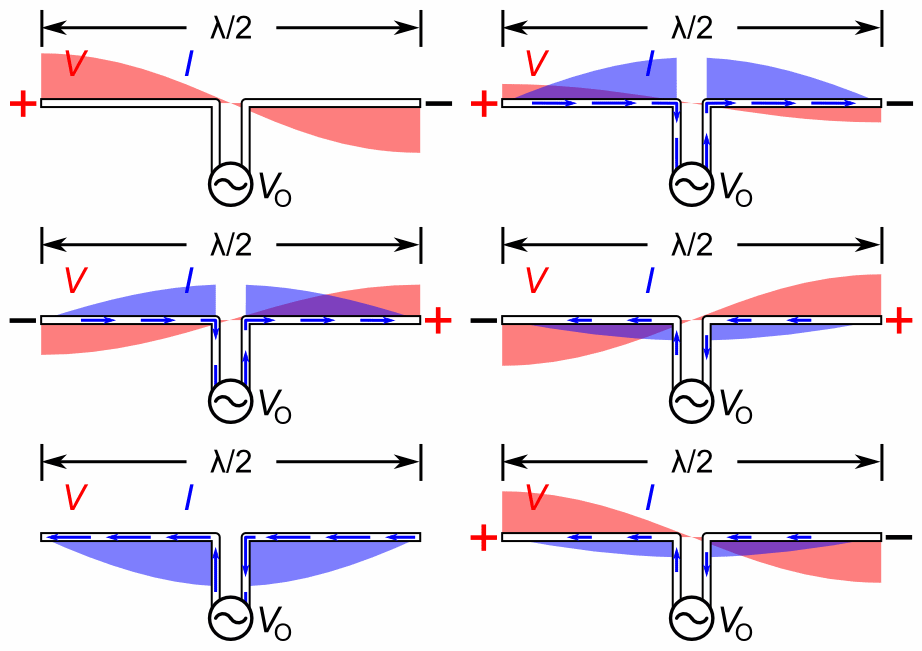
The animation below from Wikipedia shows the standing waves of voltage and current on an ideal center fed resonant half wave dipole in free space.

Dipole standing waves animation

The red and blue curves show the change in amplitude of the actual voltage and current which exists on the antenna at each point during one cycle of the applied RF energy. The arrows are the AC current which flows through the antenna and the source. The voltage depicted is the amplitude of the electric potential at each point, and the current is the amplitude of the AC current which flows along the antenna elements at each point. The amplitude of both voltage and current changes in sinusoidal fashion at the same frequency as that of the applied RF energy, and as can be seen the voltage and current are 90 deg out of phase in time and space, in fact the voltage lags the current by 90 deg (you can't see this in the animation) which makes sense because the dipole is a big capacitor in which the voltage also lags the current by 90 deg.

But everyone knows that the voltage and current are in phase at the feed point of a resonant half wave dipole and the animation shows that the voltage and current are clearly not in phase, so it all seems very self contradictory and incestuously mutually exclusive. The phase difference between the standing waves cannot be the condition which determines the reactance present on the antenna, even though the amplitudes of the standing waves at the feed point determine the real part of the impedance of the dipole at the feed point ie: Z = E / I.

The amplitudes of the standing waves of voltage and current vary in sympathy with the sinusoidal change in amplitude of the applied RF energy at the feed point. The positions of the peaks and troughs of the standing wave remain stationary and fixed in space along the length of the antenna. The standing waves result from the vectorial addition of the amplitudes of voltage and current of the traveling wave emanating from the feed point towards the ends of the dipole, and that of the reflected wave, and are the actual conditions present on the antenna which can be measured. The original incident and reflected traveling waves cannot exist independently of each other and cannot be measured as their existence is obscured by the vectorial addition of each to the other.

Even though the voltage and current of the incident and reflected traveling waves can't be seen because they have been added together and so result in the standing waves present, they must exist otherwise there would be no standing waves.

Is it the difference in phase of the voltage and current which results from addition of the incident and reflected traveling waves at any point along the lengths of the dipole elements which determines the amount of reactance present at each point ?

$\endgroup$

3 Answers 3

8
$\begingroup$

So yeah, this image is confusing. There's actually a section on the talk page questioning its correctness. I've considered a few times just deleting it, because it's so damn confusing.

The arrows are the AC current which flows through the antenna and the source.

I'm not sure we can say that. Notice the arrows are at any instant of equal magnitude at all points on the antenna, from the tips to the center. If we make the assumption (a reasonable one, I think) that the length of the arrow corresponds to the instantaneous current at that point, this suggests the instantaneous current at the end of the antenna at any point is equal to the same at the feedpoint. Which is impossible, since the current at the end of the antenna has no further length of wire in which to flow, and it's this abrupt end of the wire that's responsible for making the dipole resonant.

The voltage depicted is the amplitude of the electric potential at each point, and the current is the amplitude of the AC current which flows along the antenna elements at each point.

Here I guess you're talking about the area under the solid curves.

The current curve has the problem of being in direct contradiction with the arrows. Ostensibly both represent current somehow, but the arrows don't taper towards the ends while the curve does.

The voltage curve has the problem of being rather vague. It can't be voltage at some point on the wire, because if we consider this dipole to be made of an ideal conductor then the electric potential at every point on the wire is equal, because that's the definition of an ideal wire. And sure a real dipole is made of a wire with resistance where this isn't true, but a theoretical dipole made with an ideal conductor still works (again, theoretically) so this can't be important to the fundamental operation of the antenna.

So then we can say the curve represents electric potential or field intensity or something, but at what point? 1 cm from the wire? 1 mm? And the electric field is pointing in what direction? Does the area under the curve represent only that part of the electric field vector that's parallel to the antenna, or is it simply the field vector's magnitude? If it's just the magnitude then what's it mean when the curve reverses polarity? Why the electric field would be represented by this filled curve is beyond me, since we already have a way to represent electric fields in a drawing which is widely understood and unambiguous.

There is perhaps one thing about this image that's insightful, and it comes from the Wikipedia talk page:

The graphic is correct. The misunderstanding arises from the misapplication of the statement " Voltage and current are of course always in phase in a resonant antenna (a purely resistive load)". The load seen at the feed point will be resistive in a resonant antenna (at the exact resonant frequency), and any energy being fed into the dipole will be composed of in phase current and voltage. However, the energy STORED in the antenna (and any resonant circuit) is stored in electric and magnetic fields which are continuously "sloshing" back and forth. In a high Q circuit the stored energy will dwarf the energy being added and lost. It is this stored energy that produces the current and voltage that is shown in the graphic. Energy is conserved. If the energy being added fro the source and that being radiated away equal each other, and if these are small compared to the stored energy, then we know that the energy stored in the electric field will be proportional to the square of the voltage on the ends of the dipole. The energy stored in the magnetic field will be proportional to the square of the current in the center of the dipole. For the total energy to be constant, the current and voltage MUST BE OUT OF PHASE. At one moment all the energy is in the magnetic field, 90 degrees later it is all in the elecric field. At any other moment it is shared but the total is not changed. This applies to all resonant circuits, not just a dipole. I hope this helps.

Besides being one giant paragraph with a lot of ALL CAPS, there's a kernel of insight in there. Paraphrasing:

A dipole, like any resonant system, involves the storage of energy alternating between two forms. In mechanical oscillators (bells, springs, pendulums, ...) the forms are gravitational potential and kinetic energy. In a dipole, the energy oscillates between the electric and magnetic fields.

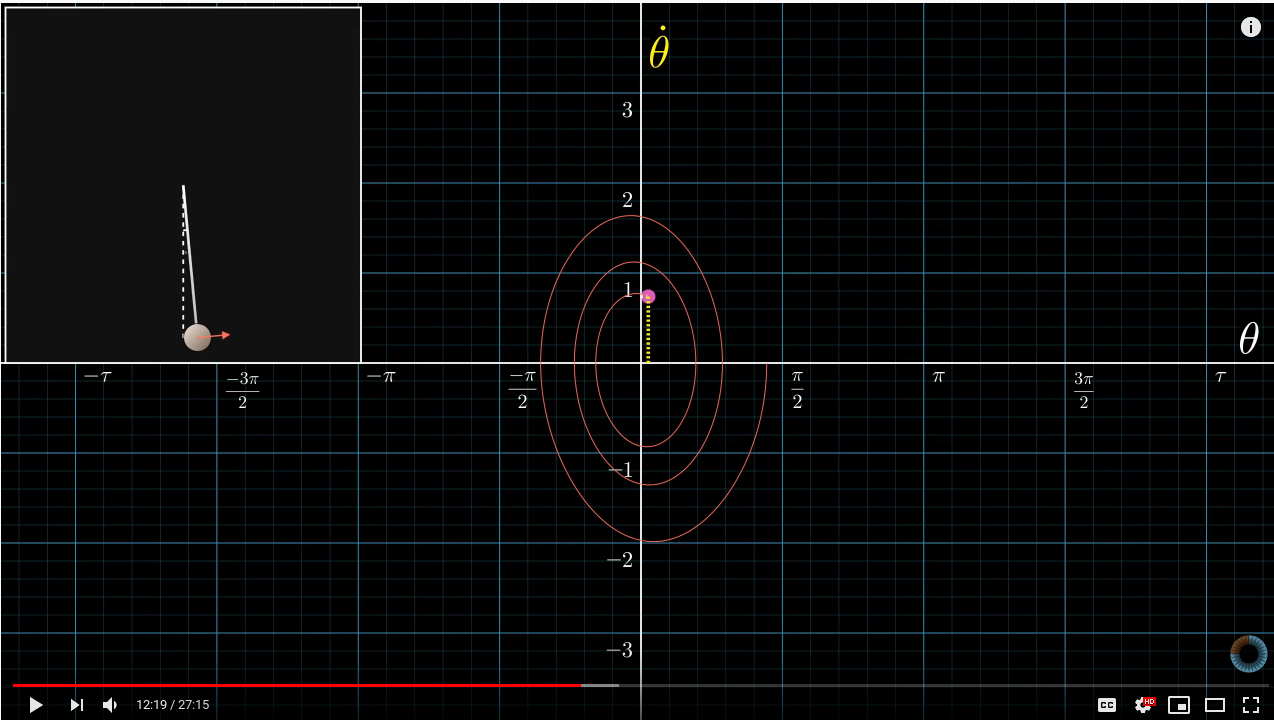
In many such resonant systems, to the extent that it has no losses, when one form is at a maximum the other will be at zero. The two, plotted over time, will be in quadrature. 3Blue1Brown has a nice visualization of this for a pendulum:
enter image description here

Here the horizontal axis (labeled $\theta$) is the pendulum's angle from vertical, and the vertical axis ($\dot\theta$) is the angular velocity. Notice: the state of the pendulum traces circular shapes. Additionally this particular illustration includes a small loss due to air friction, but regardless you can see the two variables are mostly in quadrature and mostly trace a circle because the loss is small compared to the energy stored: it has a high Q-factor.

Antennas are no different: they tend to be resonant systems with a high Q-factor. And likewise, if you were to plot the potential energy of the electric field and the magnetic field around the antenna over time, you would find these to be sinusoidal functions approximately in quadrature. The higher the Q factor, the more true this is.

I believe this is what the image is trying to convey, it just does a terrible job due to the numerous ambiguities as mentioned.

It may help to further consider that the voltage at the feedpoint terminals need not necessarily relate to the red "voltage" curve. Part of what makes the image confusing is it just says "voltage". But this isn't rigorous language: it could mean "electric potential difference" (the thing an ordinary voltmeter with two leads measures) but it could also mean electric potential, not easily measured with common equipment. According to my best guess at what the image is trying to convey, what's intended is the latter, while what nearly everyone will think "voltage" means is the former.

Put another way: there's no reason peak electric potential difference between the feedpoint's terminals must coincide with peak energy stored in the electric field.

Further consider: if we assume maximum voltage (ahem...electric potential difference) is applied at the feedpoint at the same time feedpoint current is at a maximum, we would expect (due to the length of the dipole arm) to see maximum voltage at the end of the antenna a quarter-cycle later. And in fact, this is precisely what's shown in the image.


I think this is a much better image to communicate the point:

enter image description here

This is actually a cheap crop of an animation of a transmission line. It is open on the right side, and imagine the left side as the feedpoint. It is a quarter-wavelength long.

You can see that the arrows, representing the electric field between the two conductors of the transmission line, are strongest when current is zero. Meanwhile the current is strongest when the arrows are zero. Thus these two quantities are in quadrature, as in the dipole image in the question.

A dipole is simply a quarter-wave section of transmission line like this which has been cut down the middle and pulled apart.
$\endgroup$
9
  • $\begingroup$ Phil thanks very much for taking time to answer this question, The BlueBrown graph is very good i think, if there were a graph like that which showed a dipole input and then incident, reflected and standing wave of voltage and current, and also the complex reactance at each point that would go a long way to clearing up the confusion. $\endgroup$
    – Andrew
    Commented Jun 29, 2020 at 0:35
  • 1
    $\begingroup$ It's astonishing to me how hard it is to find a decent explanation on the internet about how this stuff works. I think the Wikipedia page needs changing because it's way too vague as you say. I've read 6 books on antennas including the ARRL handbook which in my opinion is useless and searched the internet for weeks to get where i am and i''m not there yet. I'm currently digesting your answer, thanks again. $\endgroup$
    – Andrew
    Commented Jun 29, 2020 at 0:37
  • $\begingroup$ The one question that i would really like to know the answer to is this -> "The phase difference of "........................" causes the reactance at each point on a dipole " ? $\endgroup$
    – Andrew
    Commented Jun 29, 2020 at 0:42
  • 2
    $\begingroup$ @Andrew A half-wave dipole is just a quarter-wave transformer that's been pulled apart. So if you can understand how a quarter-wave transformer works, you're 90% of the way to understanding a dipole. $\endgroup$ Commented Jun 29, 2020 at 0:49
  • 1
    $\begingroup$ @Andrew Electric potential difference (colloquially just "voltage") is to electric potential (also measured in volts) as two-terminal impedance (colloquially just "impedance") is to wave impedance (also measured in ohms). Given sufficient context, "impedance" might be understood to mean specifically wave impedance which is defined at a single point, but you have to be careful to keep your mental models straight. Wave impedance is not the same thing as feedpoint impedance, despite being related and measured in the same units. $\endgroup$ Commented Jun 29, 2020 at 16:49
5
$\begingroup$

You're reading too much into the Wikipedia picture! I think it's been asked before. It's also wrong about the zero voltage at the middle.

Voltage and current can never be exactly 90 degrees apart because this would imply pure capacitive or inductive reactance, and antennas have some radiation resistance too.

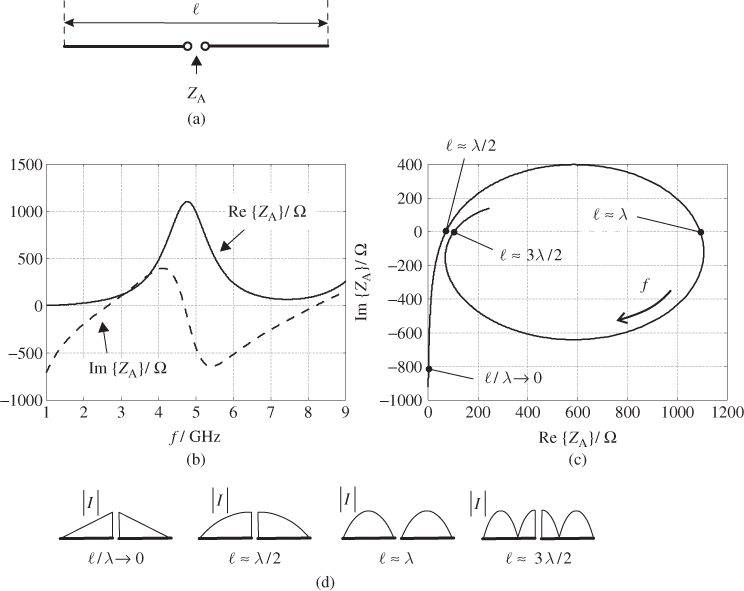
The angle changes fairly quickly near resonance though, if the dipole is too long or too short, it will be about 45 degrees leading or lagging.

Here's a graph (source):
enter image description here

On the right hand figure, the angle between voltage and current is the angle of the point from the origin - the argument of the complex impedance. So if you consider the mismatched scales, you can see the full range of angles is about +-45 degrees.

The Wikipedia animation could be correct if the antenna is just a little longer than a half wave. More likely it was made by someone who thought they should be 90 degrees apart, like a TEM wave.

$\endgroup$
3
  • $\begingroup$ Are you saying that the difference in phase between the standing waves of voltage and current at resonance must be less than 90 deg to account for the radiation resistance ? If so can you please explain further ... $\endgroup$
    – Andrew
    Commented Jun 28, 2020 at 10:03
  • 2
    $\begingroup$ I'm just referring to the input impedance, the ratio between voltage and current at the centre. Z = R+jX and if R > 0 then arg(Z) must be between - 90 and 90. $\endgroup$
    – tomnexus
    Commented Jun 28, 2020 at 20:35
  • 1
    $\begingroup$ If you curve (confusingly) labeled "V" as somehow representing electric potential, then the image is neither wrong about being zero in the center, nor in being (approximately) 90 degrees out of phase with the "I" curve which represents the magnetic field. $\endgroup$ Commented Jun 29, 2020 at 3:41
1
$\begingroup$

Consider an RLC resonant circuit. The current through the resistor is in phase with the voltage across it, while those through the inductor and the capacitor lag and lead their corresponding voltages by 90°. The inductive and capacitive currents cancel out leaving the overall resistive current, flowing into the RLC circuit terminals, in phase with the applied voltage.

A resonant antenna is equivalent to an RLC resonant circuit. Even though the voltage and current distribution across the antenna is 90° out of phase, the current fed into the antenna is in phase with the applied voltage and together they constitute the power that is radiated, ignoring any losses.

$\endgroup$
0

You must log in to answer this question.

Not the answer you're looking for? Browse other questions tagged .