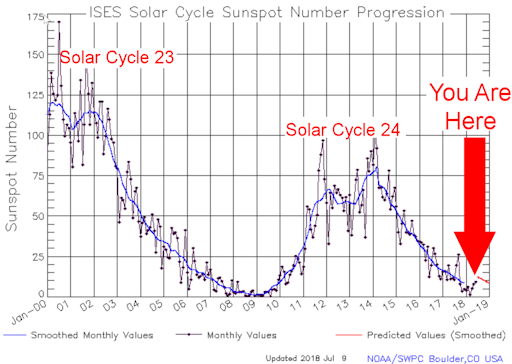
Are we now at the good or bad portion of the 11 years cycle? What effect are we seeing now? How large (strong/deep) is the effect during the peak and bottom of cycle? What will change in coming years?
-
1$\begingroup$ Here are a couple of web sites I use for looking up such information: solarscience.msfc.nasa.gov/predict.shtml, and solarham.net, and there are others. $\endgroup$– K7PEHCommented Jul 3, 2016 at 1:52
-
$\begingroup$ +1 comment vote for solarham.net. New to me. :-) $\endgroup$– user157Commented Jul 3, 2016 at 22:43
-
$\begingroup$ Maybe it's time for a new question about the current year. $\endgroup$– Mike WatersCommented Mar 5, 2019 at 15:51
-
1$\begingroup$ I posted a new question about 2019 here. $\endgroup$– Mike WatersCommented Mar 5, 2019 at 19:45
2 Answers
We're about half way down in the waning years of Cycle 24. We're currently on a 9 day stretch with zero sunspots, the first such stretch since 2010.
With the number of sunspots dwindling, we've seen little F layer propagation on frequencies above 25MHz in the last 2 months, and that downward trend is likely to continue. As we approach minimum in 2018(ish), frequencies above 15MHz will only open sporadically and usually thanks to Sporadic E or Trans-equitorial low angle F layer propagation for a couple weeks on either side of the Equinoxes.
In addition to the impact on the higher bands, the mid bands like 20m and 30m will no longer stay open all night, though they will generally continue to produce good DX during the day even at solar minimum. During the minimum of cycle 23, 20 meters rarely failed to open in the afternoon.
The lower solar activity actually improves conditions on 160m, 80m, and to some extent 40m, as there will be less D layer absorption, so those bands will open earlier in the evening and stay open later in to the morning than they have in the past few years. They will also experience fewer ionospheric disturbances and geomagnetic storms as solar activity tapers off.
This cycle was unusually quiet, and the previous minimum was unusually and unexpectedly protracted, so most predictions regarding the various trends and extremes of cycle 24 have so far proven to be inaccurate. It's difficult to say for sure how deep this minimum is likely to be, or how long it will last, but it is safe to assume that the occasional article that pops up claiming we're entering a new Maunder Minimum or the like are just psuedo-scientific rantings. This cycle caught everyone off guard, and proved just how bad we are at predicting these things.
Historically, if we look at the long term trends we can see that while cycle 24 was quite weak, if we look at the cycles before it, there is a clear cyclic trend that dates back to at least the late 18th century. It would appear we're entering a low point in that larger cycle, but it seems likely that cycle 25 and 26 will rebound somewhat or be about the same. Given the rapid descent from the peak in 2014, however, it seems safe to assume this will be another unusually long minimum.
-
$\begingroup$ Thanks for explanation. Where is an easy accessible free software to predict opening between two points, on certain band/time/date? Is voacap.com/prediction.html the best or there are other similar? Apart from WSPR, is there any system that actually measure propagation on a long term basis? To what extend does prediction software agree with actual measurements,like WSPR? What software is available to 'analyze and distill' raw WSPR measurements into 'visualization chart' (or similar) showing openess (signal level/probability of success) between two points on certain band/time/date? $\endgroup$– EEdCommented Jul 3, 2016 at 14:42
-
$\begingroup$ The comments are very limited for space, so I can't answer most of your questions very well. VOACAP is good but has trouble with sudden changes like flares. There are other sites like Propnet.org and PSKreporter that can give real time propagation info. Software can only tell you conditions, actual measurements are extremely situation/equipment dependent, so they are never very precise, and there are scripts and programs that can analyze WSPR data in various ways. You can find some of those on the WSPR forum or with a google for "WSPR database visualizations" or similar. $\endgroup$ Commented Jul 4, 2016 at 19:06
-
$\begingroup$ @EEd consider asking lengthy questions in a new question post. $\endgroup$ Commented Jul 5, 2016 at 16:55
According to this chart, 2016 was not the solar minimum. We appear to be at or very near the minimum right now. However, we won't know for sure until some more time passes.
Yesterday on spaceweather.com, the following information appeared:
THREE WEEKS WITHOUT SUNSPOTS: The sun has been blank for 21 days--3 whole weeks without sunspots. To find an equal number of consecutive spotless days in the historical record, you have to go back to July-August 2009 when the sun was emerging from an unusually deep solar minimum. Solar minimum, welcome back!
Space weather forecasters have long wondered, will the next solar minimum (2018-2020) be as deep as the previous one (2008-2009)? Twenty-one days without sunspots is not enough to answer that question. During the solar minimum of 2008-2009, the longest unbroken interval of spotlessness was ~52 days, adding to a total of 813 intermittent spotless days observed throughout the multi-year minimum. The corresponding totals now are only 21 days and 244 days, respectively. If this solar minimum is like the last one, we still have a long way to go.
At the moment there are no nascent sunspots on the solar disk, so the spotless days counter is likely to keep ticking. Stay tuned for more blank suns.
-
$\begingroup$ Comments are not for extended discussion; this conversation has been moved to chat. $\endgroup$ Commented Jul 18, 2018 at 16:36
